
A website that suddenly takes seconds to load is very often waiting on the database. The slow query log records every query that takes longer than a set time, and mysqldumpslow turns that log into a short report: which queries are slow, how often they run, and how much time they cost in total.
This guide shows how to turn on the slow query log, read it with mysqldumpslow, and act on what you find.
What is mysqldumpslow?
mysqldumpslow is a Perl script that ships with MySQL. On MariaDB it's called mariadb-dumpslow. Older MariaDB releases also had a mysqldumpslow alias, but newer ones, like the official MariaDB 11+ Docker images, only have mariadb-dumpslow. It reads the slow query log and groups queries that are the same except for their values. For example these two queries:
SELECT * FROM wp_posts WHERE ID = 1520;
SELECT * FROM wp_posts WHERE ID = 87;
are shown as one entry:
SELECT * FROM wp_posts WHERE ID = N
That grouping is what makes it useful. A raw slow log can have thousands of lines, but usually only a handful of distinct queries are causing the problem.
Step 1: Turn on the slow query log
The slow query log is off by default in MySQL and MariaDB. Three settings control it:
| Setting | What it does | Suggested value |
|---|---|---|
slow_query_log | Turns the log on or off | ON |
long_query_time | Queries slower than this many seconds are logged | 1 (or 0.5 for busy sites) |
slow_query_log_file | Where the log is written | /var/lib/mysql/<hostname>-slow.log by default |
You can set them in my.cnf under [mysqld]:
[mysqld]
slow_query_log = ON
long_query_time = 1
slow_query_log_file = /var/lib/mysql/mysql-slow.log
and restart the service, or turn them on at runtime without a restart:
SET GLOBAL slow_query_log = 'ON';
SET GLOBAL long_query_time = 1;
Settings changed with SET GLOBAL are lost on restart, so add them to my.cnf too if you want to keep them.
The default long_query_time is 10 seconds. A page that runs twenty 0.5 second queries feels very slow, but none of those queries would ever reach the log. Start with 1 and lower it if the log stays empty.
In OpenPanel
In OpenPanel each user has their own MySQL or MariaDB service, so you can turn on the slow query log for your own databases without root access or SSH:
- Go to MySQL > Configuration.
- Set
slow_query_logtoONandlong_query_timeto1. - Click Save Changes. The settings are written to your
custom.cnfand the database service is restarted.
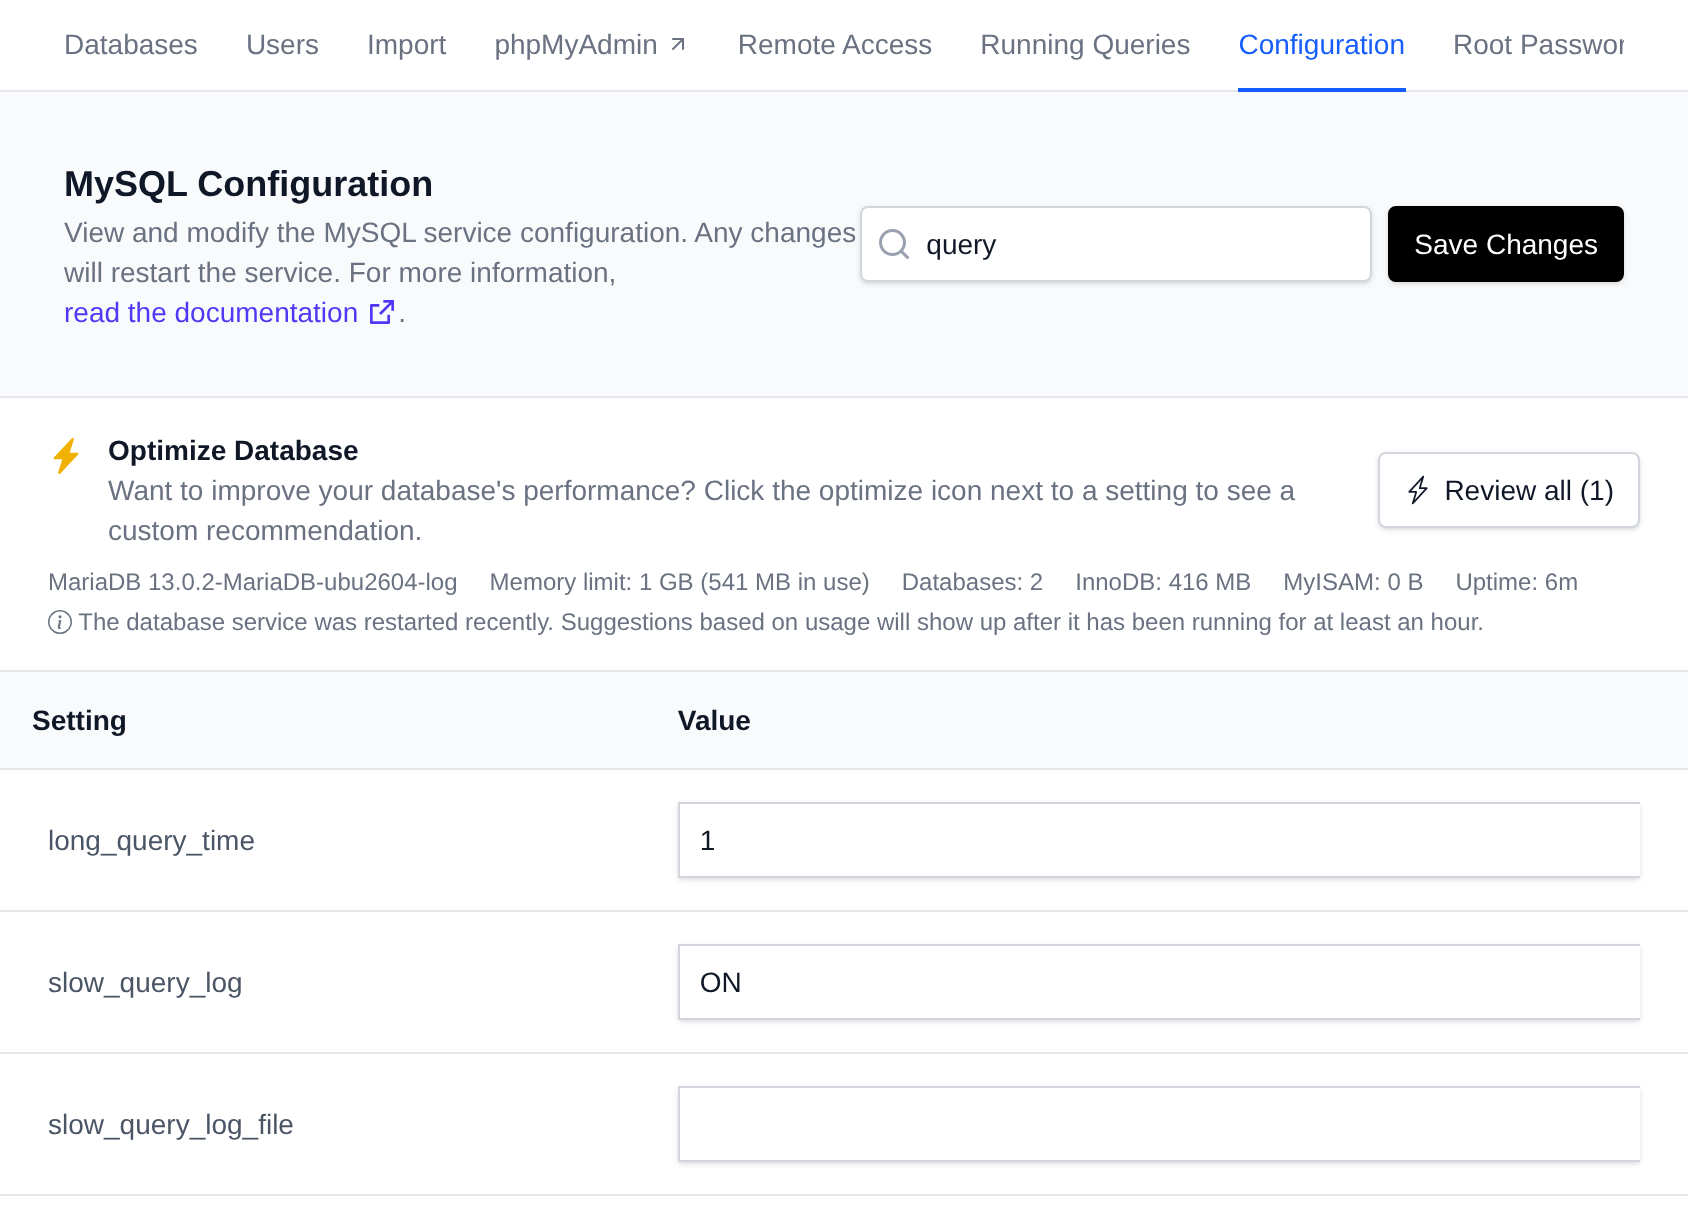
The Optimize Database check on the same page also helps here: it tells you how many queries were slower than long_query_time since the last restart, suggests turning the log on if it's off, and suggests lowering long_query_time if it's set so high that most slow queries are never logged.
Leave the log on for a few hours, or a day, of normal traffic before you analyze it.
Step 2: Run mysqldumpslow
Point mysqldumpslow at the log file:
mysqldumpslow /var/lib/mysql/mysql-slow.log
On MariaDB:
mariadb-dumpslow /var/lib/mysql/mariadb-slow.log
Not sure where the log is? Ask the server:
SHOW VARIABLES LIKE 'slow_query_log_file';
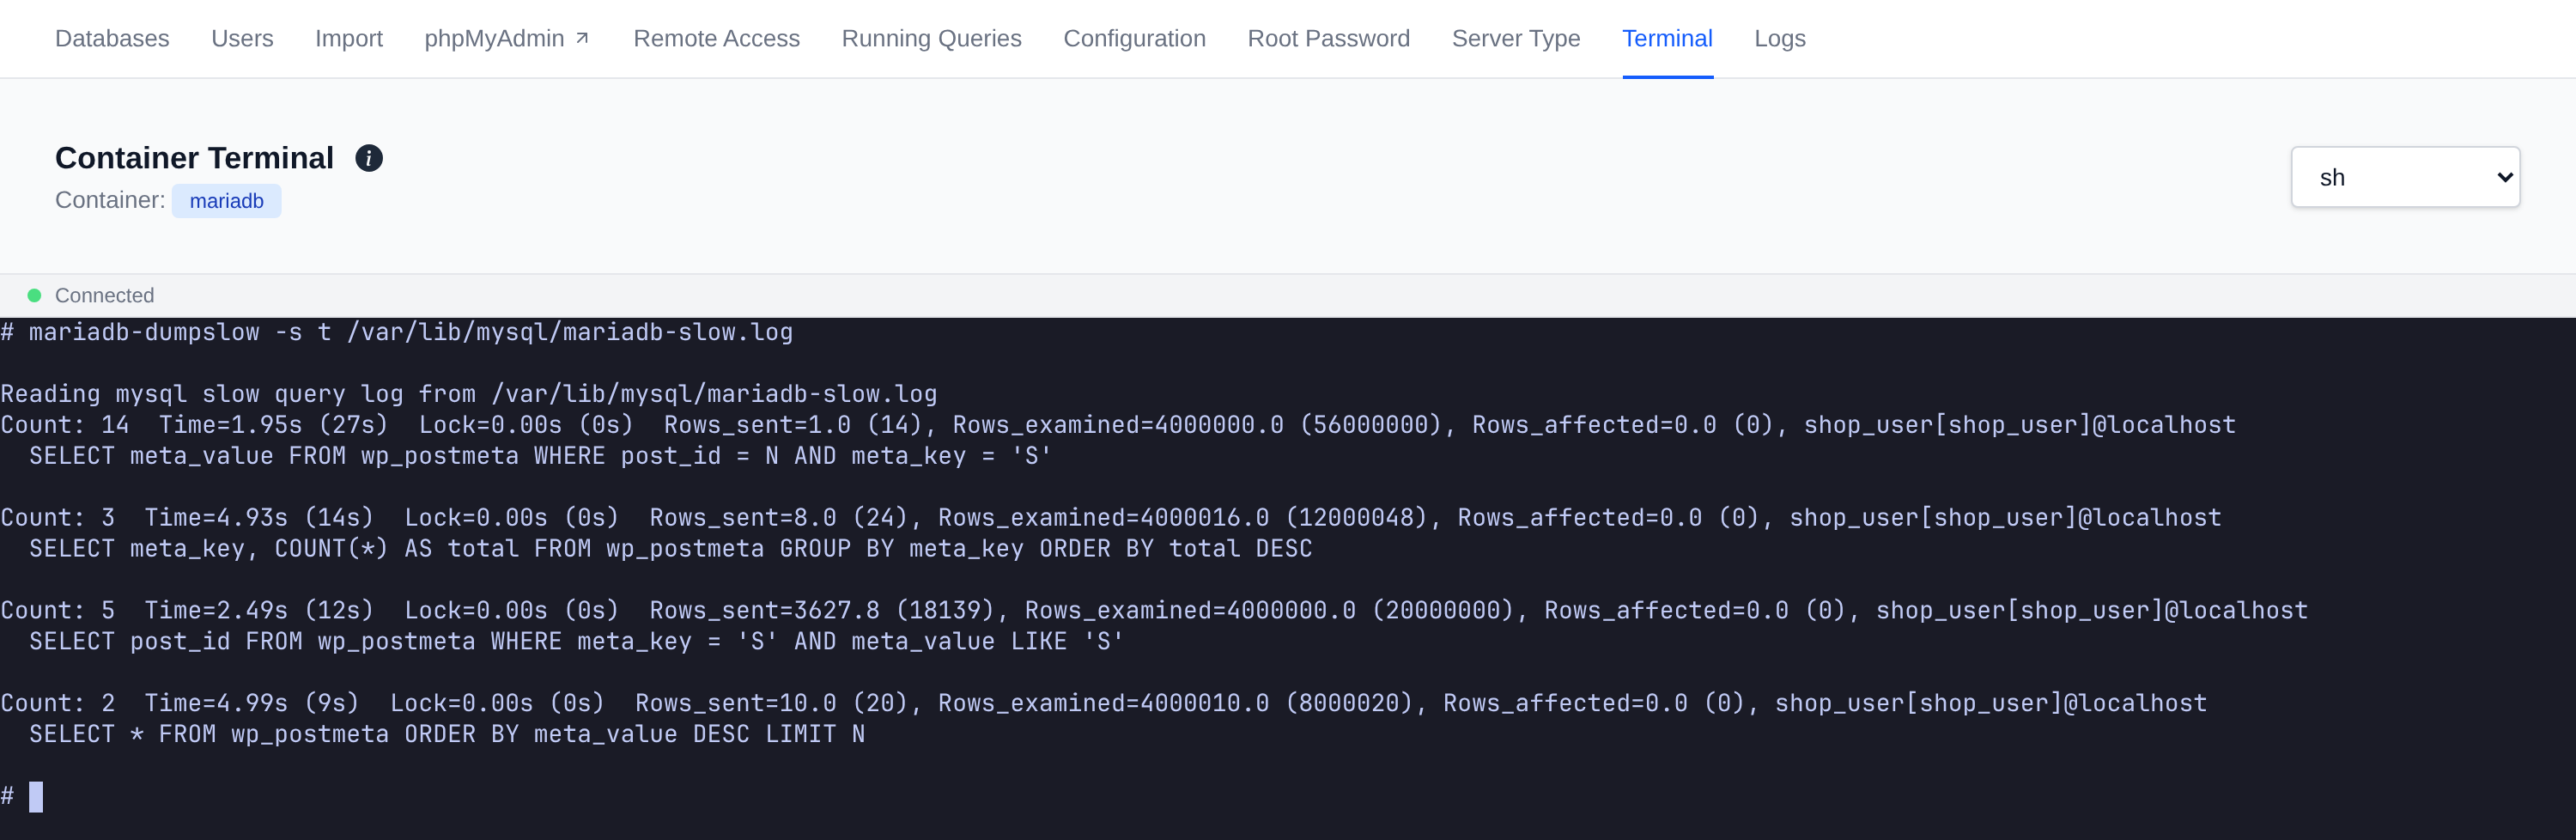
In OpenPanel, open MySQL and use the Terminal tab to get a shell inside your database service, then run the command there. The log file is in /var/lib/mysql/ and is named after the service, mysql-slow.log or mariadb-slow.log.
Here is mariadb-dumpslow running in the OpenPanel terminal, on a WooCommerce-style wp_postmeta table with 4 million rows:
Step 3: Read the output
Each entry has a summary line and the normalized query. The first entry from the report above:
Count: 14  Time=1.95s (27s)  Lock=0.00s (0s)  Rows_sent=1.0 (14), Rows_examined=4000000.0 (56000000), Rows_affected=0.0 (0), shop_user[shop_user]@localhost
  SELECT meta_value FROM wp_postmeta WHERE post_id = N AND meta_key = 'S'
| Field | Meaning |
|---|---|
Count: 14 | The query ran 14 times while the log was on |
Time=1.95s (27s) | Average time per run, and total time in brackets |
Lock=0.00s (0s) | Average and total time spent waiting for table locks |
Rows_sent=1.0 (14) | Average and total rows sent back to the client |
Rows_examined=4000000.0 (56000000) | Average and total rows read to find them (MariaDB only) |
shop_user[shop_user]@localhost | The user and host that ran it |
MySQL's mysqldumpslow prints the same line without Rows_examined and Rows_affected, and with Rows= instead of Rows_sent=.
Numbers in the query are replaced with N and strings with 'S'.
The bracketed total time is usually the number to look at first. A query that takes 0.3 seconds but runs 50,000 times costs far more than one 20 second report that runs once a night.
On MariaDB, also compare Rows_sent with Rows_examined. The query above reads all 4 million rows to return one. That almost always means a missing index.
Step 4: Sort and filter the report
The default output is sorted by average time. These options make it much more useful:
| Option | What it does |
|---|---|
-s t | Sort by total time (best starting point) |
-s c | Sort by count, the most frequent queries first |
-s at | Sort by average time (default) |
-s l / -s al | Sort by total / average lock time |
-s r / -s ar | Sort by total / average rows sent |
-t 10 | Show only the top 10 queries |
-g 'pattern' | Only show queries matching a pattern (like grep) |
-a | Don't replace values with N and 'S' |
-r | Reverse the sort order |
Some useful combinations:
mariadb-dumpslow stops with Died at /usr/bin/mariadb-dumpslow line ... when -t is larger than the number of distinct queries in the log. The report above it is still complete, so you can ignore the error, or leave out -t on small logs.
# The 10 queries that cost the most time in total
mysqldumpslow -s t -t 10 /var/lib/mysql/mysql-slow.log

# The 10 most frequent slow queries
mysqldumpslow -s c -t 10 /var/lib/mysql/mysql-slow.log

# Only queries that touch the wp_options table
mysqldumpslow -s t -g 'wp_options' /var/lib/mysql/mysql-slow.log

# Queries waiting on locks, usually MyISAM tables or long transactions
mysqldumpslow -s l -t 5 /var/lib/mysql/mysql-slow.log

# Show real values to reproduce a query
mysqldumpslow -a -s t -t 3 /var/lib/mysql/mysql-slow.log
Step 5: Fix what you find
Once you know which queries are slow, take one at a time and run it with EXPLAIN (use -a to get a real query with values):
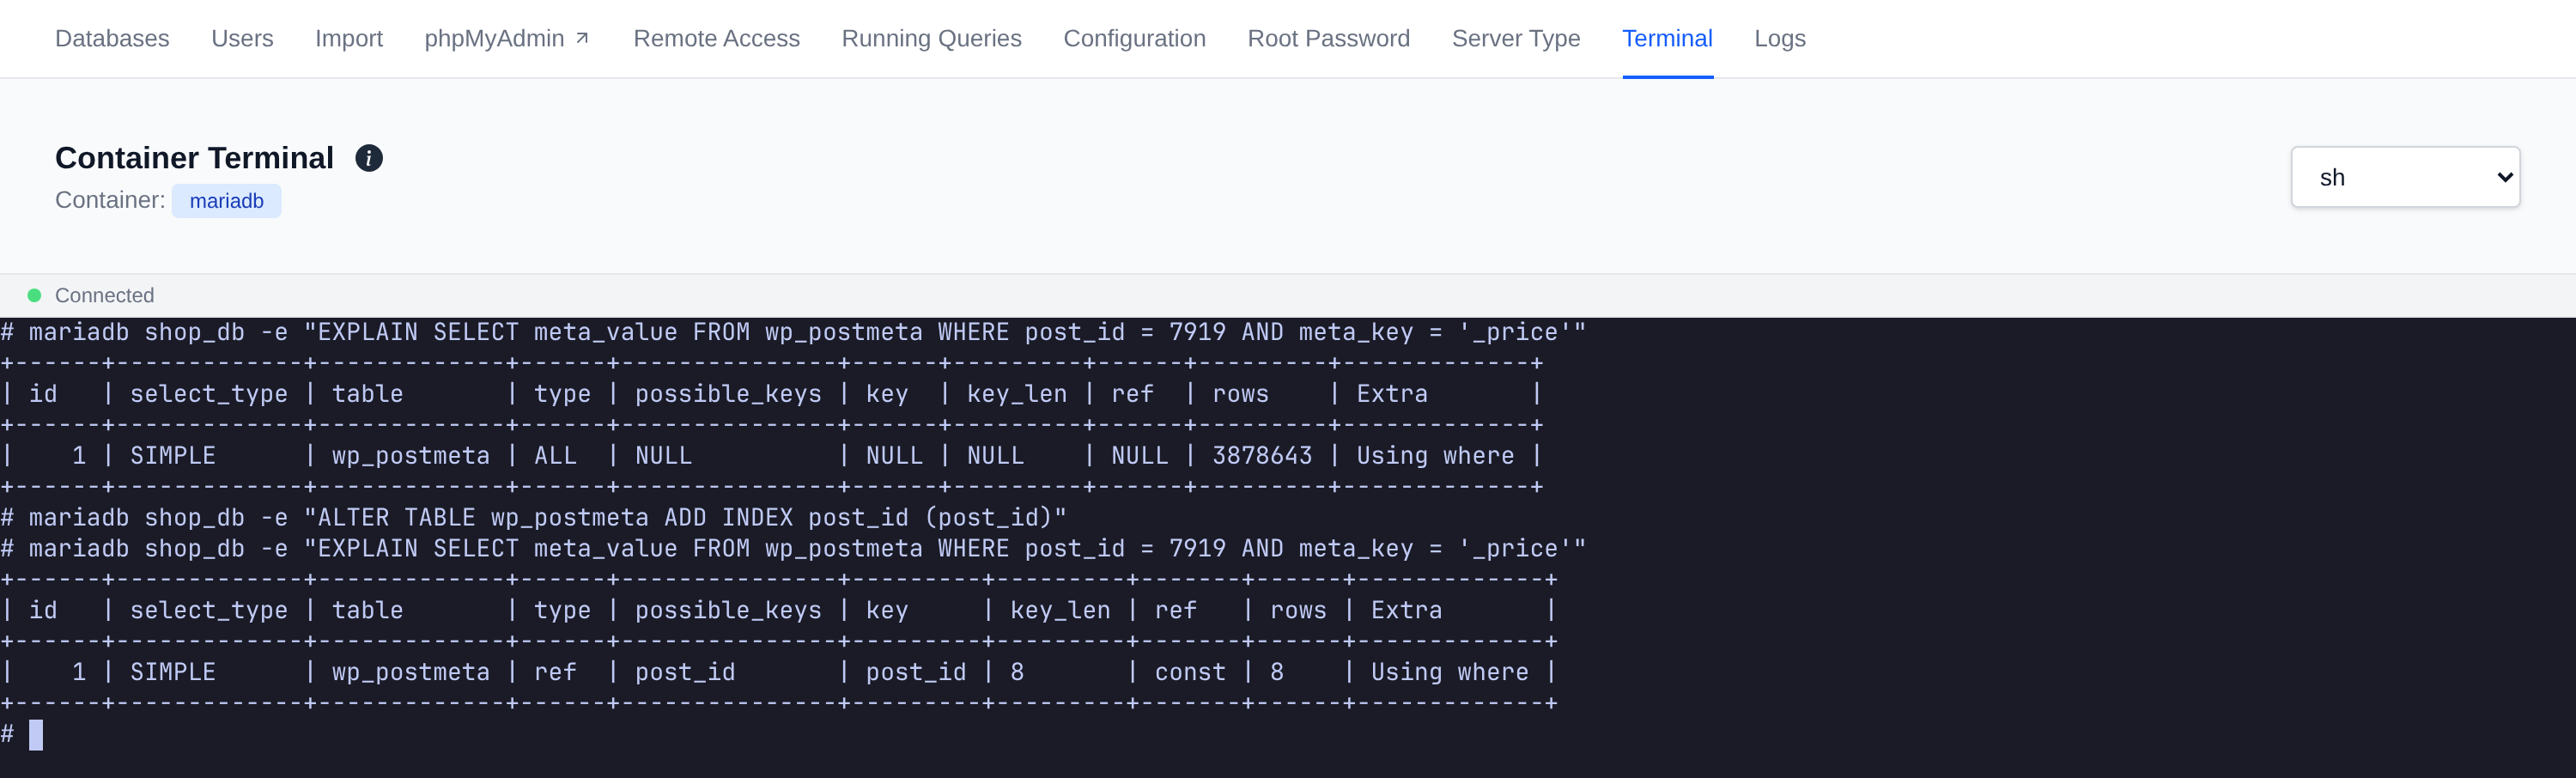
EXPLAIN SELECT meta_value FROM wp_postmeta WHERE post_id = 7919 AND meta_key = '_price';
Look at the type and rows columns. type = ALL with a large rows number means a full table scan. Our top query scanned almost 3.9 million rows because post_id had no index. After adding one, EXPLAIN shows type = ref with the new index, and only 8 rows read:
ALTER TABLE wp_postmeta ADD INDEX post_id (post_id);
The most common causes and fixes: The most common causes and fixes:
- Missing index: like the example above, the column in
WHERE,JOINorORDER BYhas no index. Add one withALTER TABLE ... ADD INDEX. - Leading wildcard:
LIKE '%text%'can't use an index. Use a full-text index or change how the query searches. - Large result sets: high
Rowsvalues mean the application loads more rows than it needs. AddLIMITor paginate. - Lock time: high
Lockvalues often point to MyISAM tables, which lock the whole table on every write. Convert them withALTER TABLE name ENGINE=InnoDB. - WordPress: slow queries on
wp_optionsusually mean too many autoloaded options, and slowwp_postmetaqueries usually come from a plugin. Try disabling plugins to find which one runs the query.
OpenPanel's Optimize Database check points out several of these for you, including MyISAM tables, tables without a primary key, large WordPress autoloaded options and joins that don't use an index.
Step 6: Clean up
The slow query log grows over time, so when you're done:
- Set
slow_query_logback toOFF, or raiselong_query_timeto log only the worst queries. - Empty the log so the next analysis starts fresh:
truncate -s 0 /var/lib/mysql/mysql-slow.log(ormariadb-slow.log)
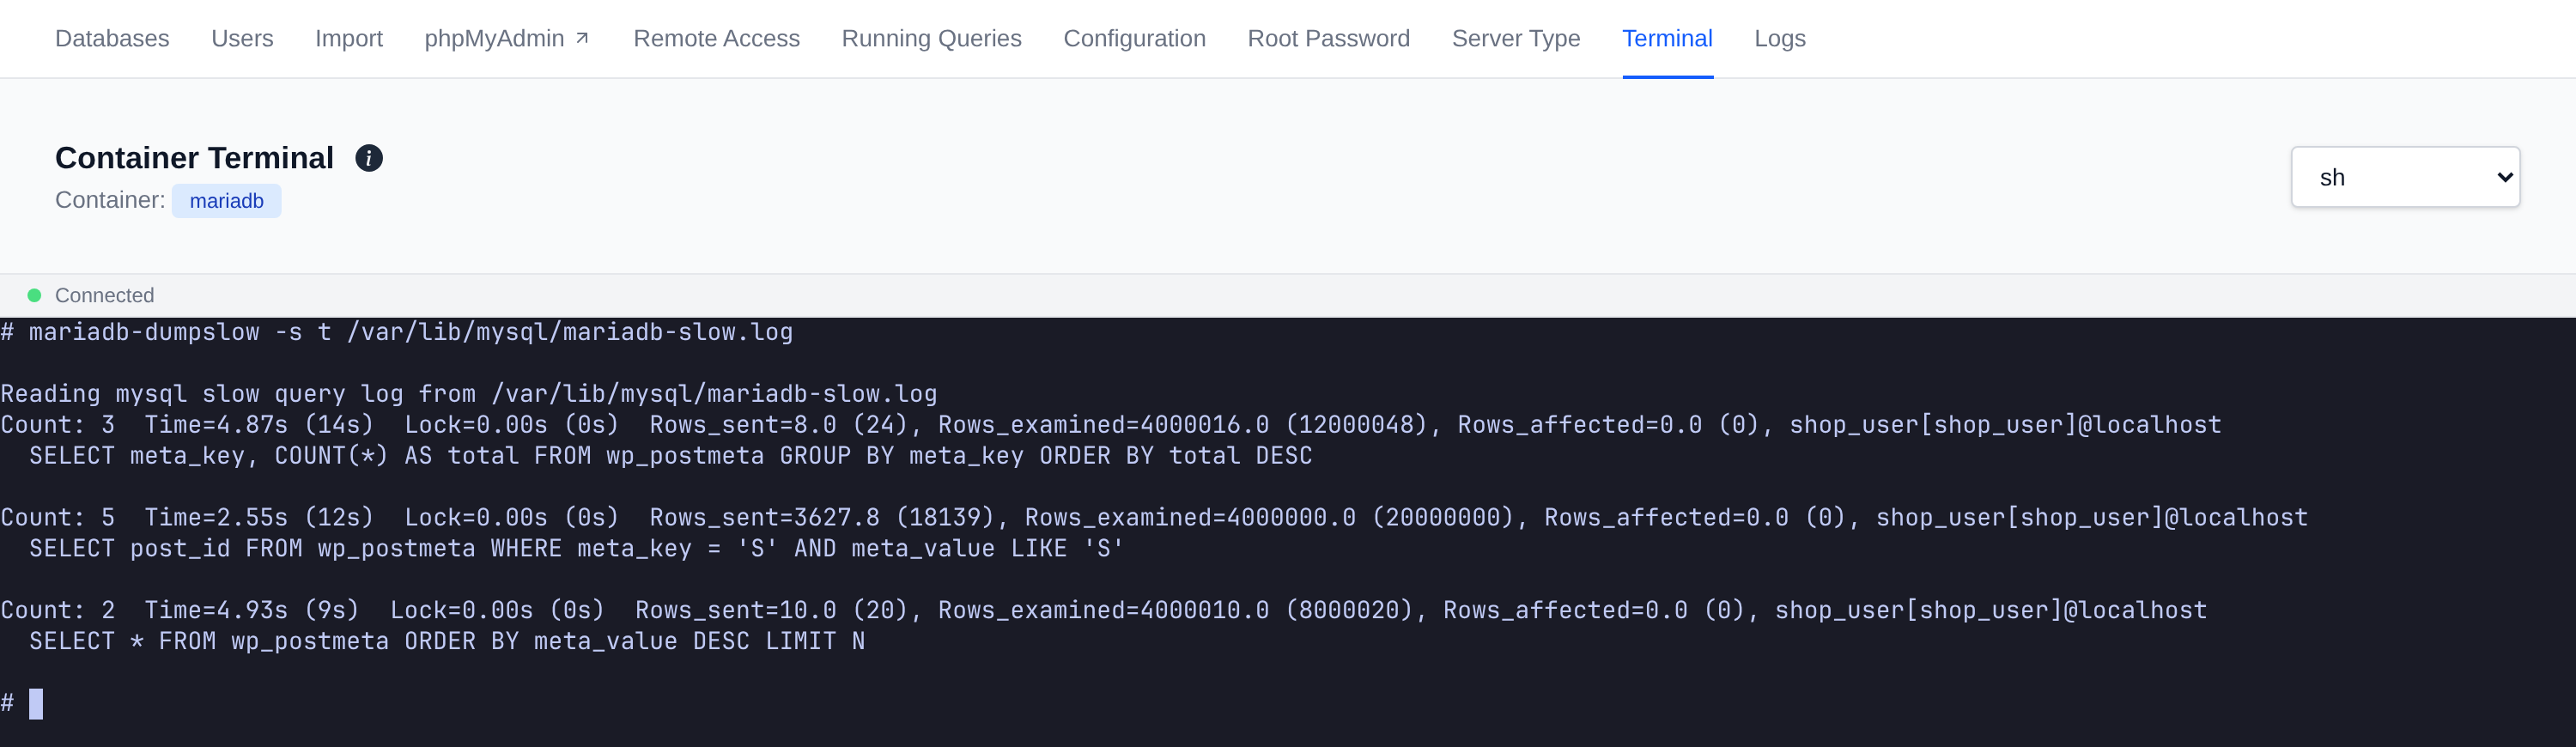
After you make changes, turn the log on again for a day and run mysqldumpslow -s t again. The queries you fixed should drop off the list. After the same traffic was run again, the post_id lookup that cost 27 seconds is gone, and the next query to fix is at the top:
Quick reference
# 1. Find the log
mysql -e "SHOW VARIABLES LIKE 'slow_query_log%'"

# 2. Turn it on
mysql -e "SET GLOBAL slow_query_log='ON'; SET GLOBAL long_query_time=1;"

# 3. Top 10 by total time (MariaDB: mariadb-dumpslow ... mariadb-slow.log)
mysqldumpslow -s t -t 10 /var/lib/mysql/mysql-slow.log

# 4. Top 10 by count
mysqldumpslow -s c -t 10 /var/lib/mysql/mysql-slow.log

# 5. Explain the worst one
mysql -e "EXPLAIN SELECT ..."
Summary
The slow query log tells you that queries are slow, and mysqldumpslow tells you which ones matter. Sort by total time, fix the top few queries, and check again.
With OpenPanel, every user has their own isolated MySQL or MariaDB service with a Configuration page to turn on the slow query log, a process list to see and kill running queries, and a terminal to run mysqldumpslow, no SSH or root access needed.