Dashboard
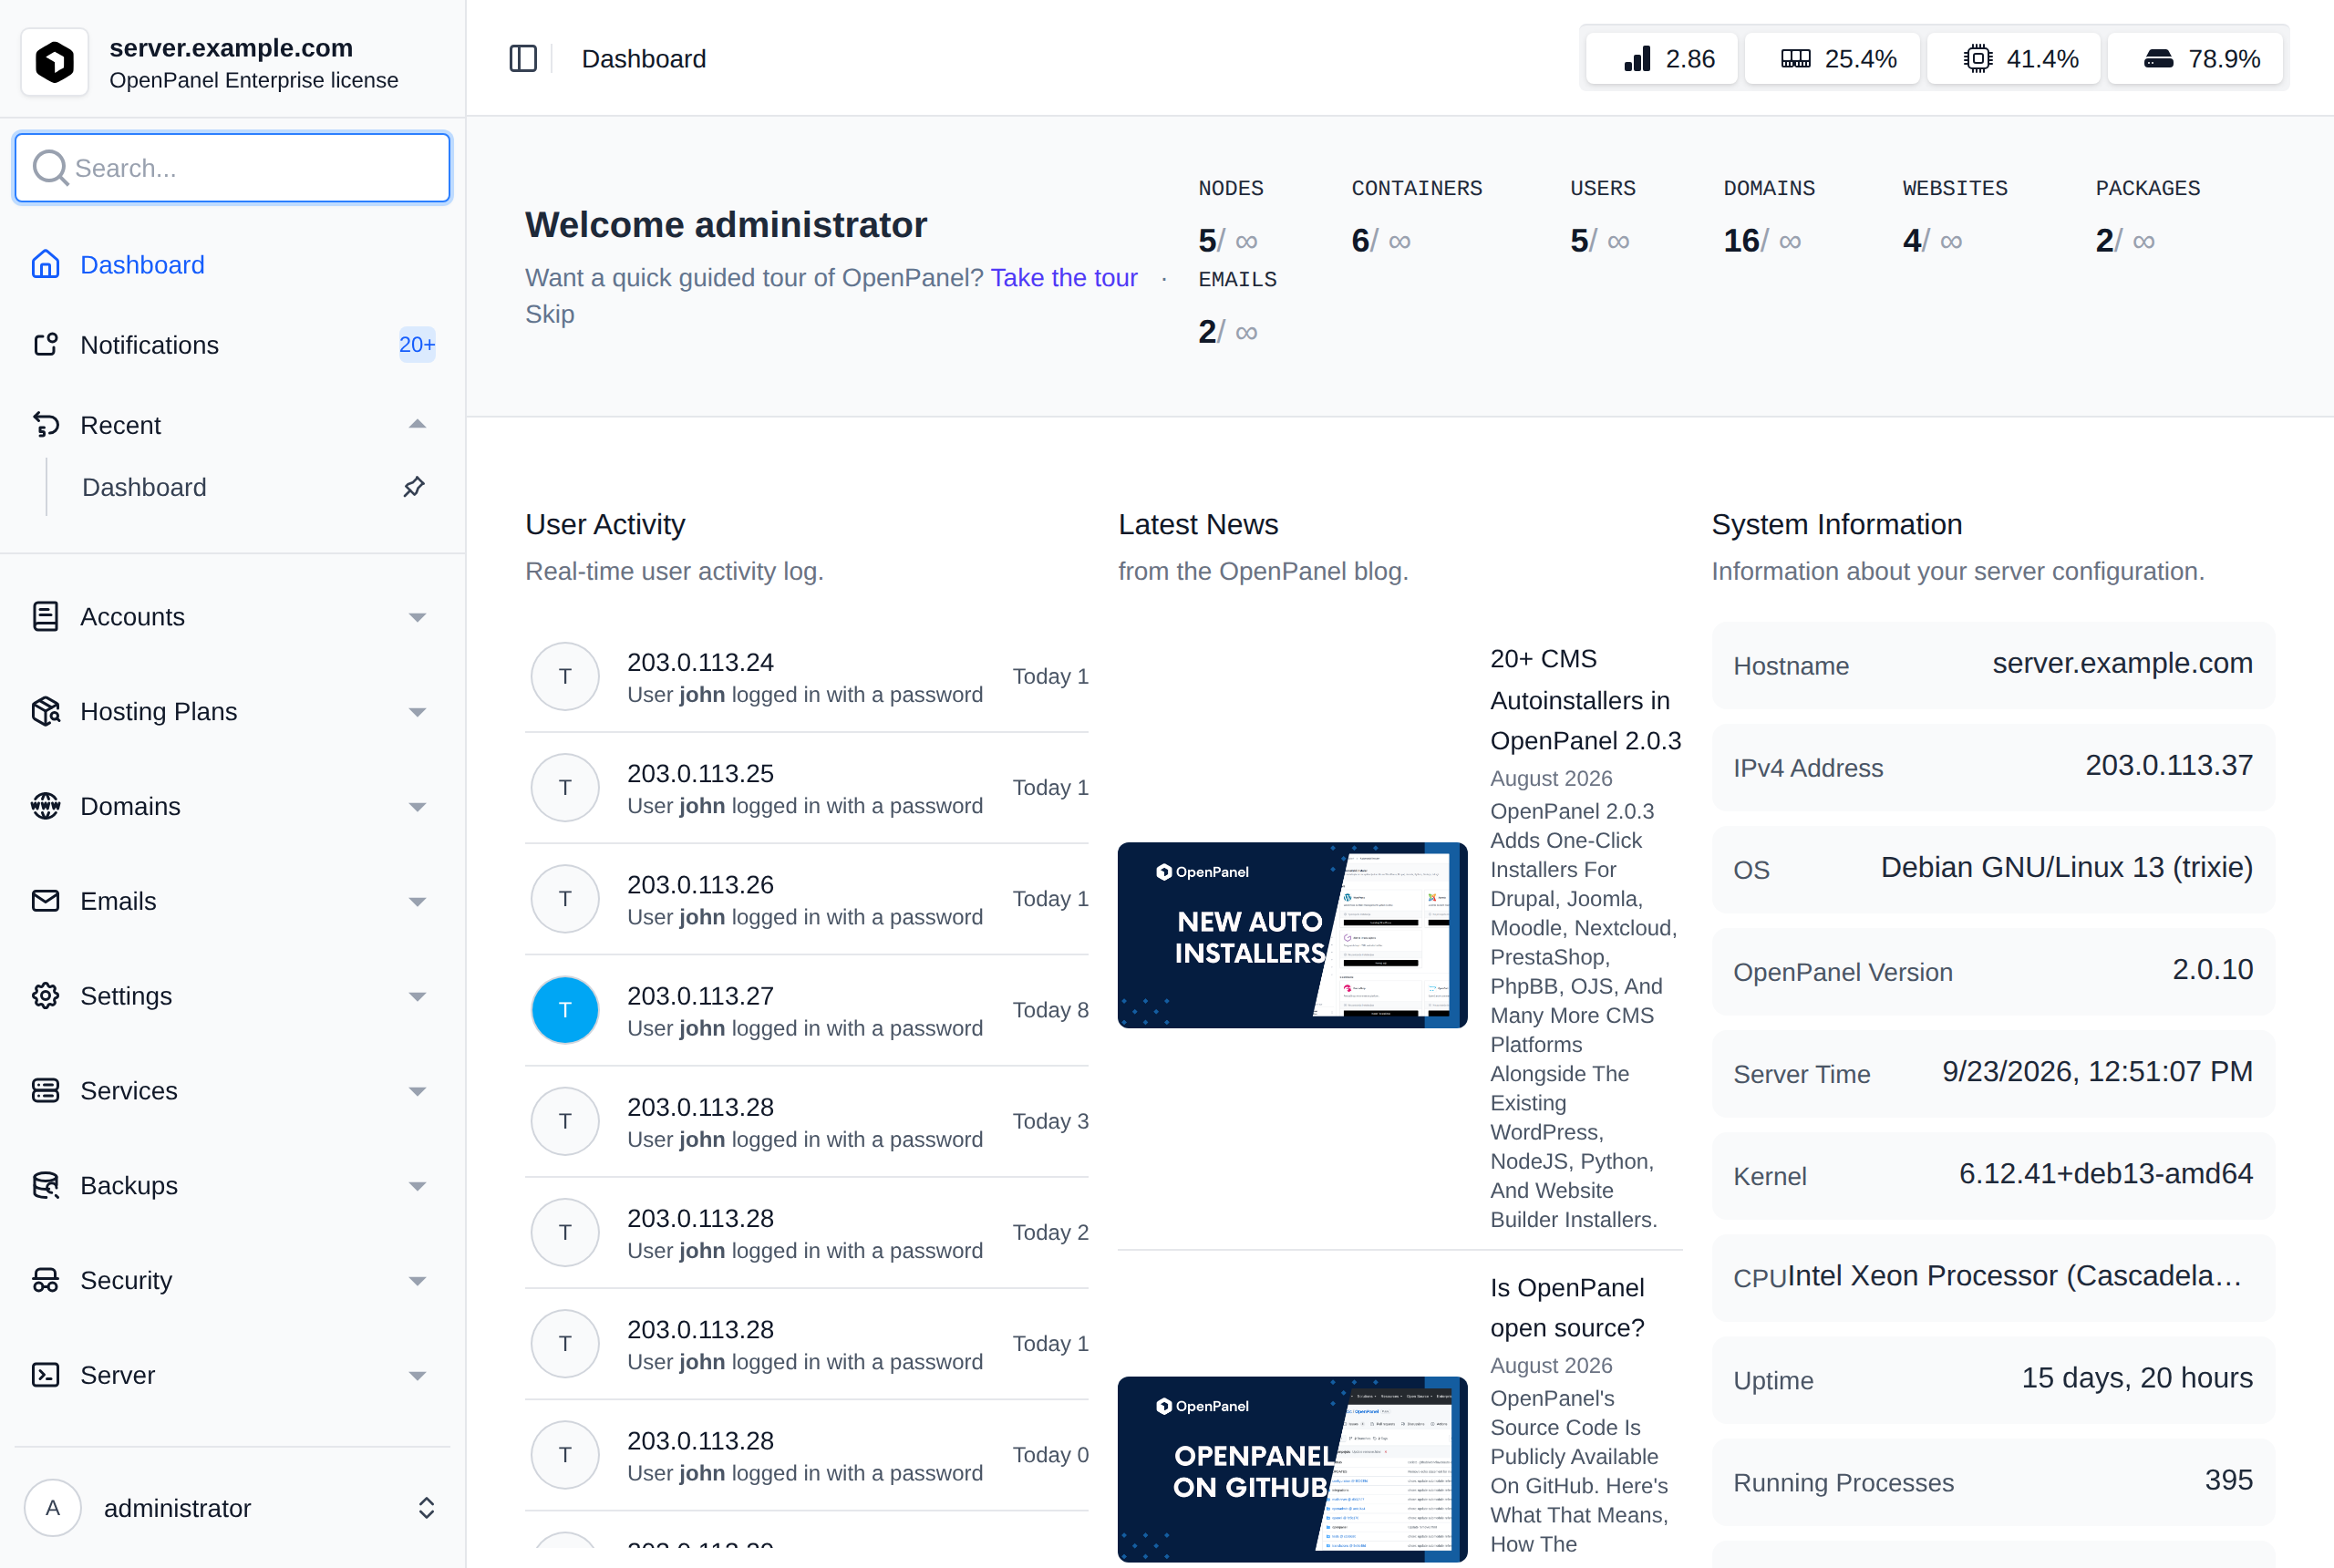
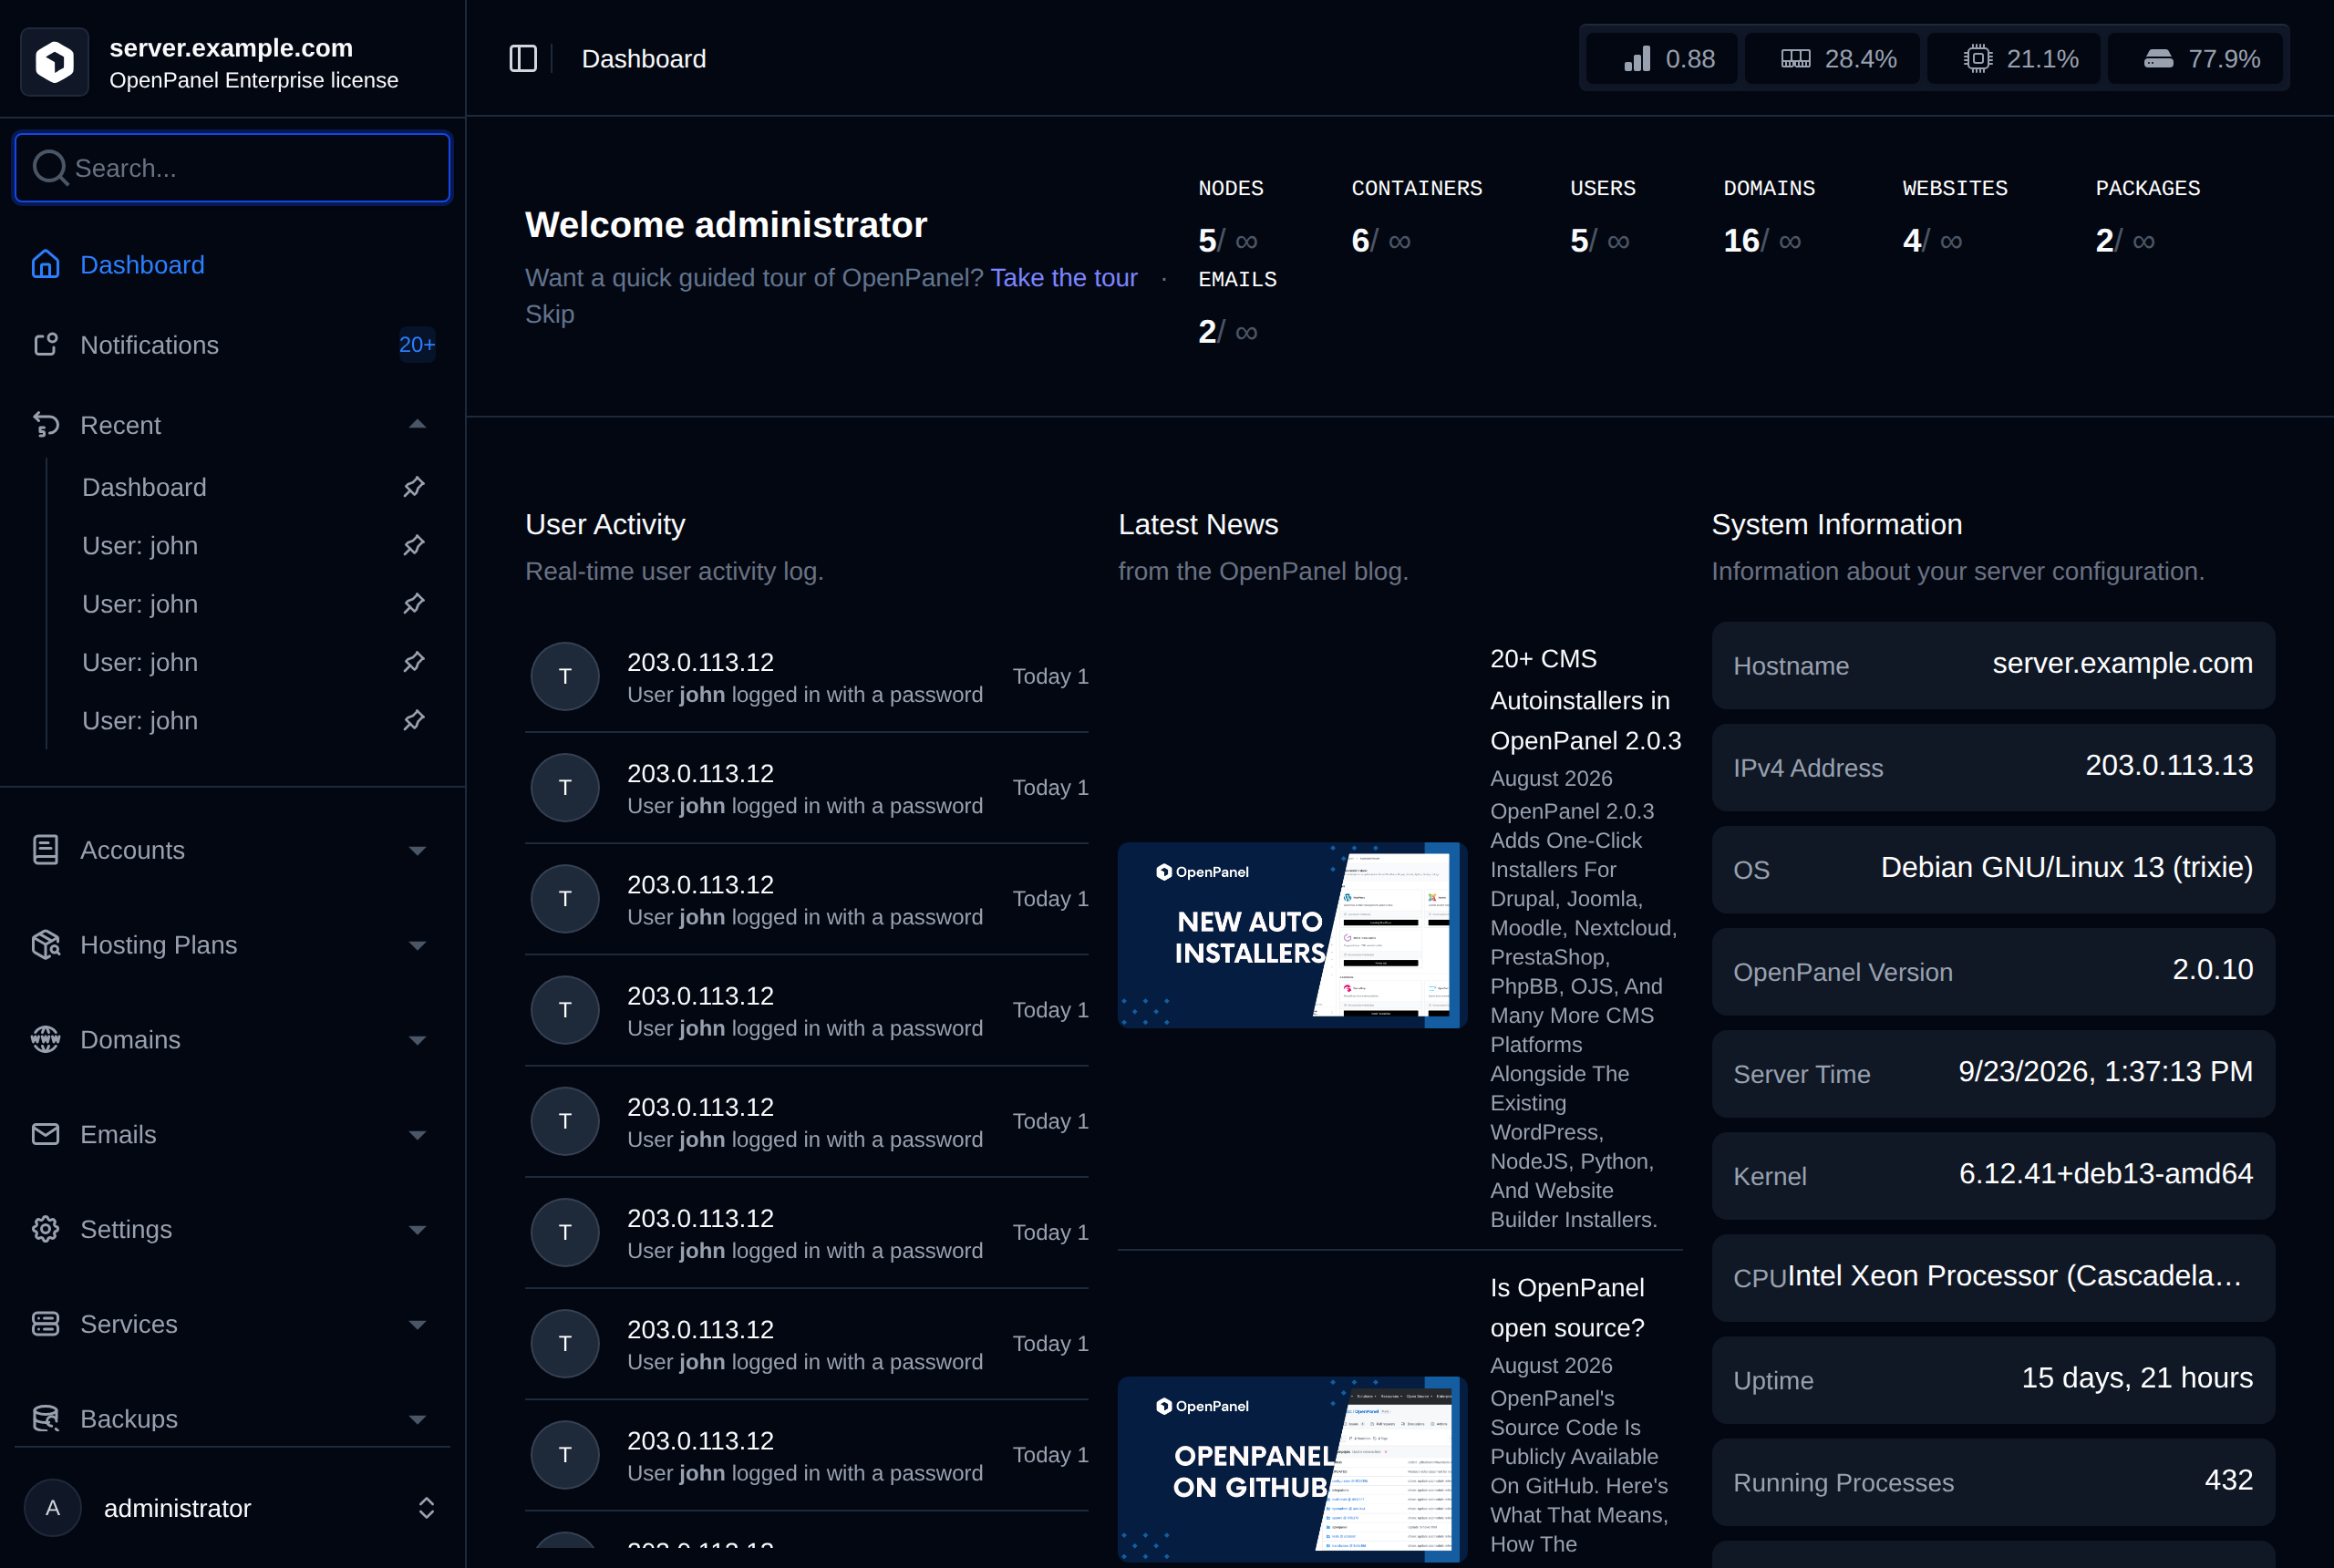
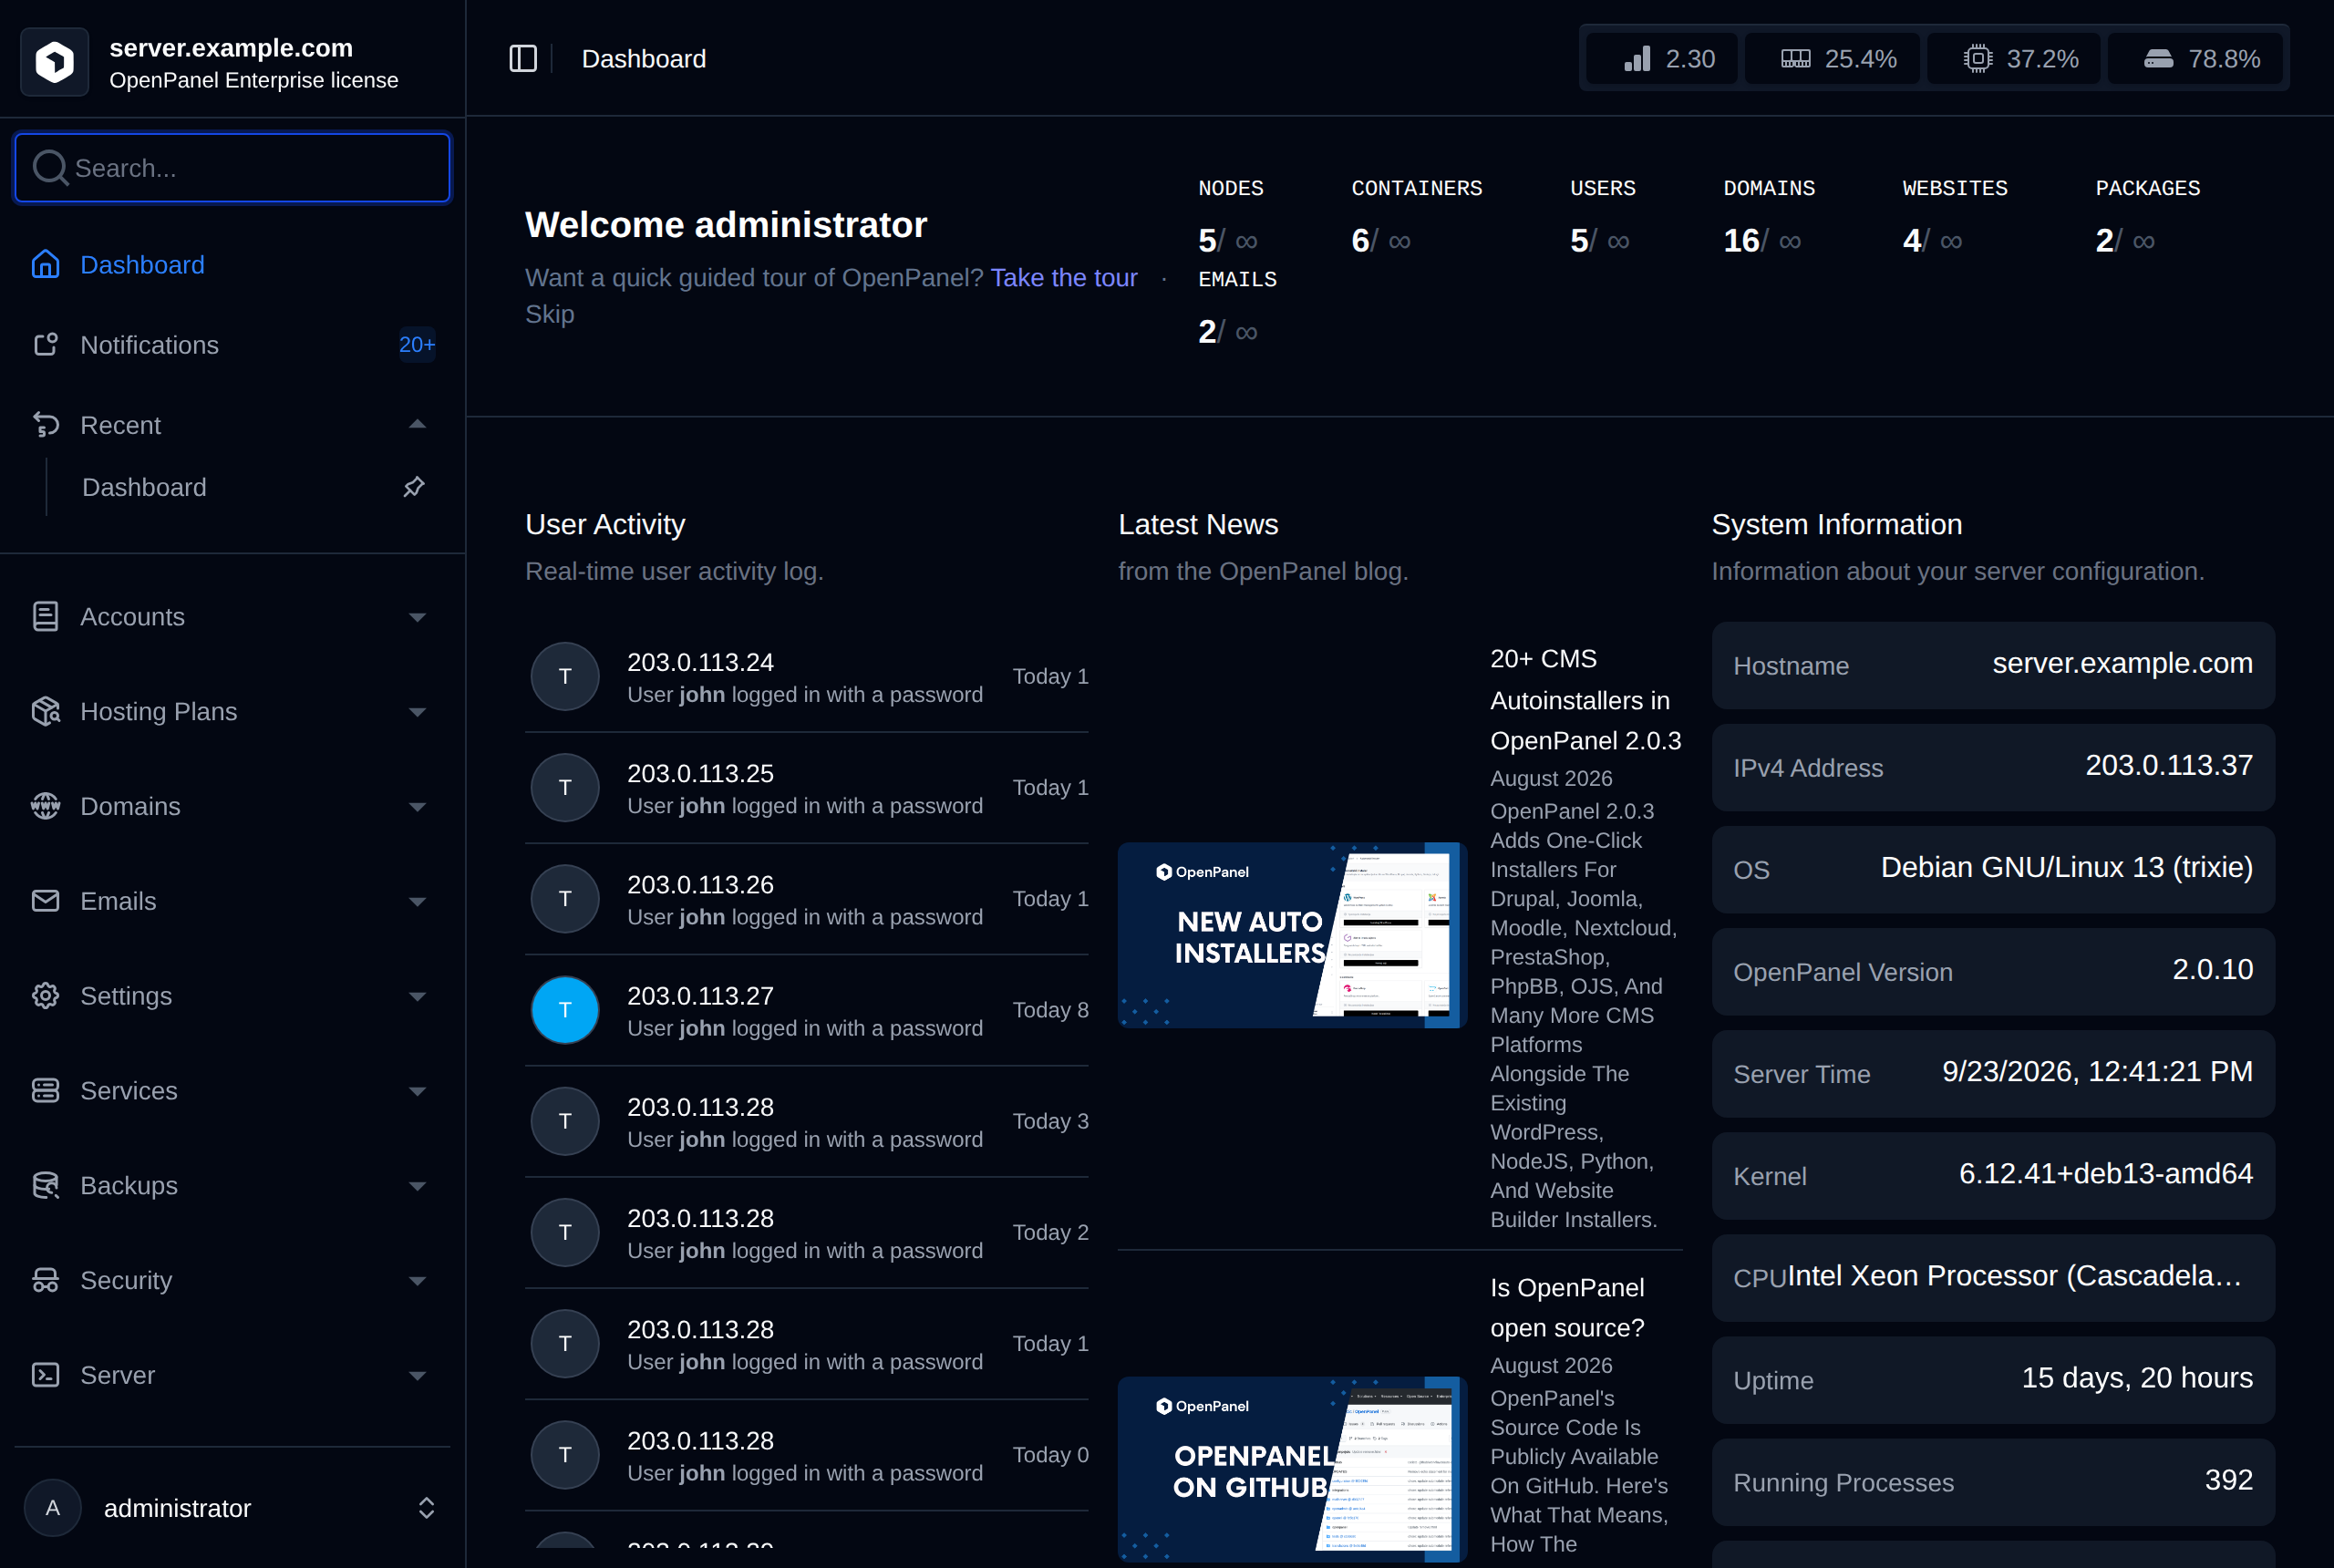
The dashboard page is the hub of the OpenAdmin interface and provides the overview of the current server performance and usage.
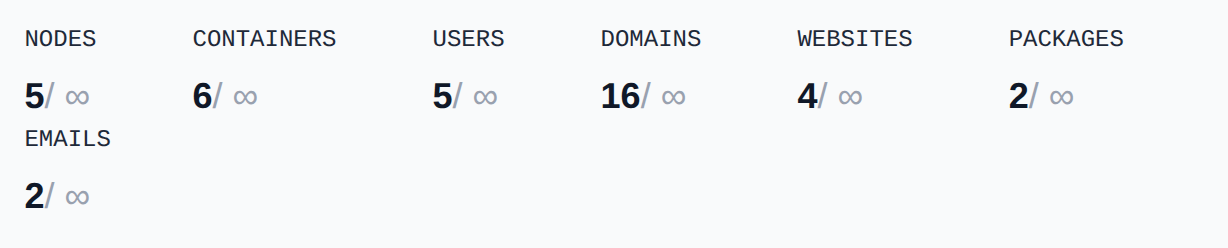
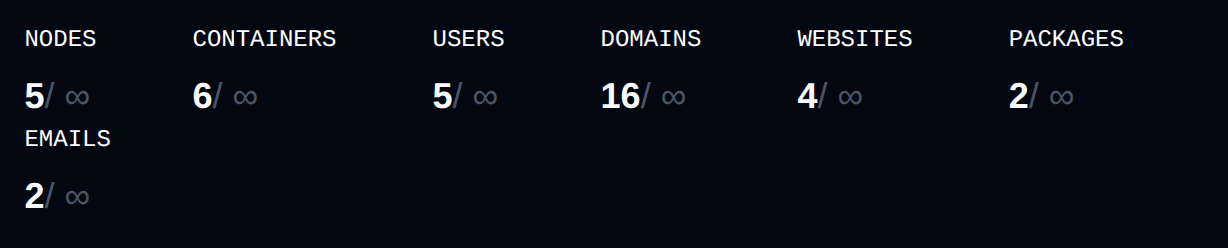
For administrator accounts, the dashboard also displays a quick summary bar with counts for Nodes, Containers, Users, Domains, Websites, Packages, and Emails (each showing current usage against the license's limit, if any). Reseller accounts instead see their own OpenPanel Accounts and Disk Space Used usage against the limits set by the administrator.
The dashboard page contains widgets:
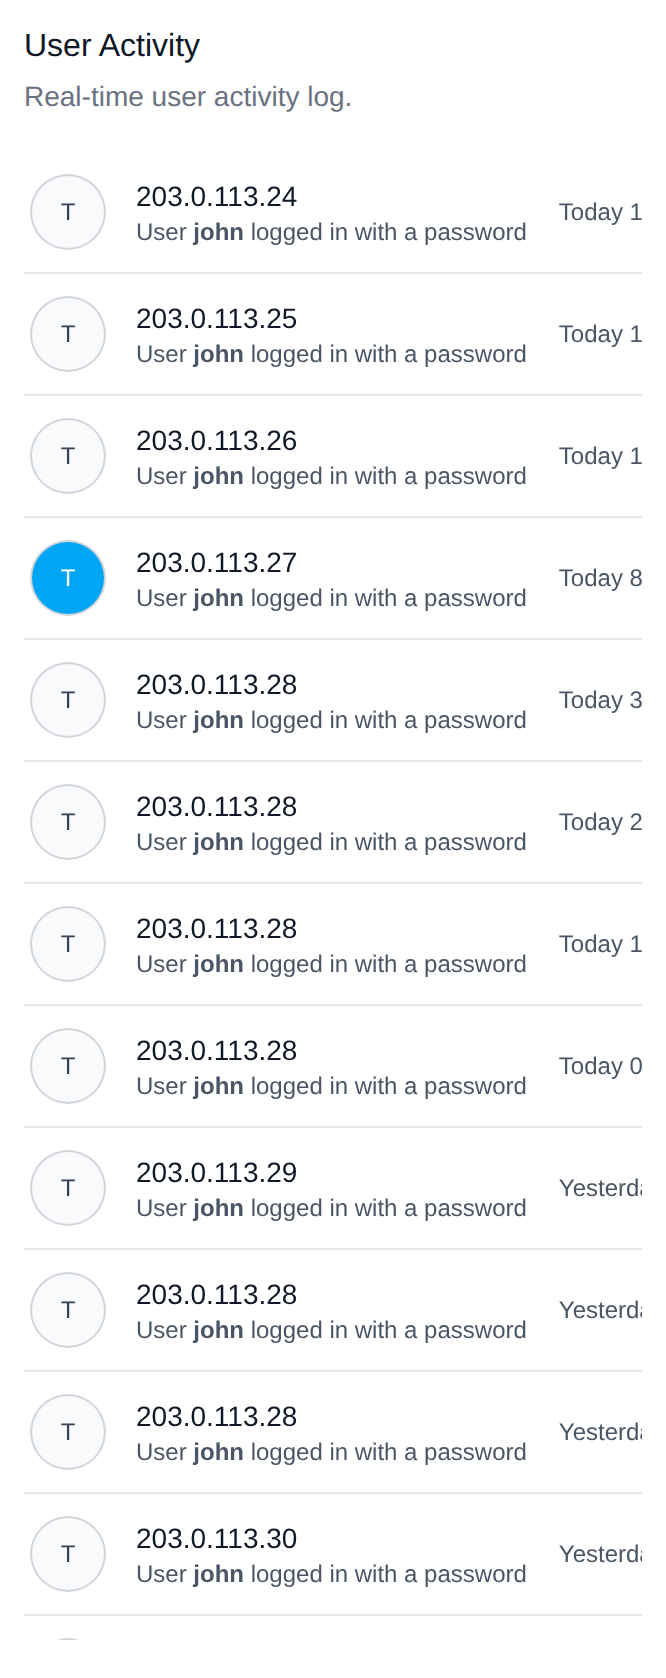
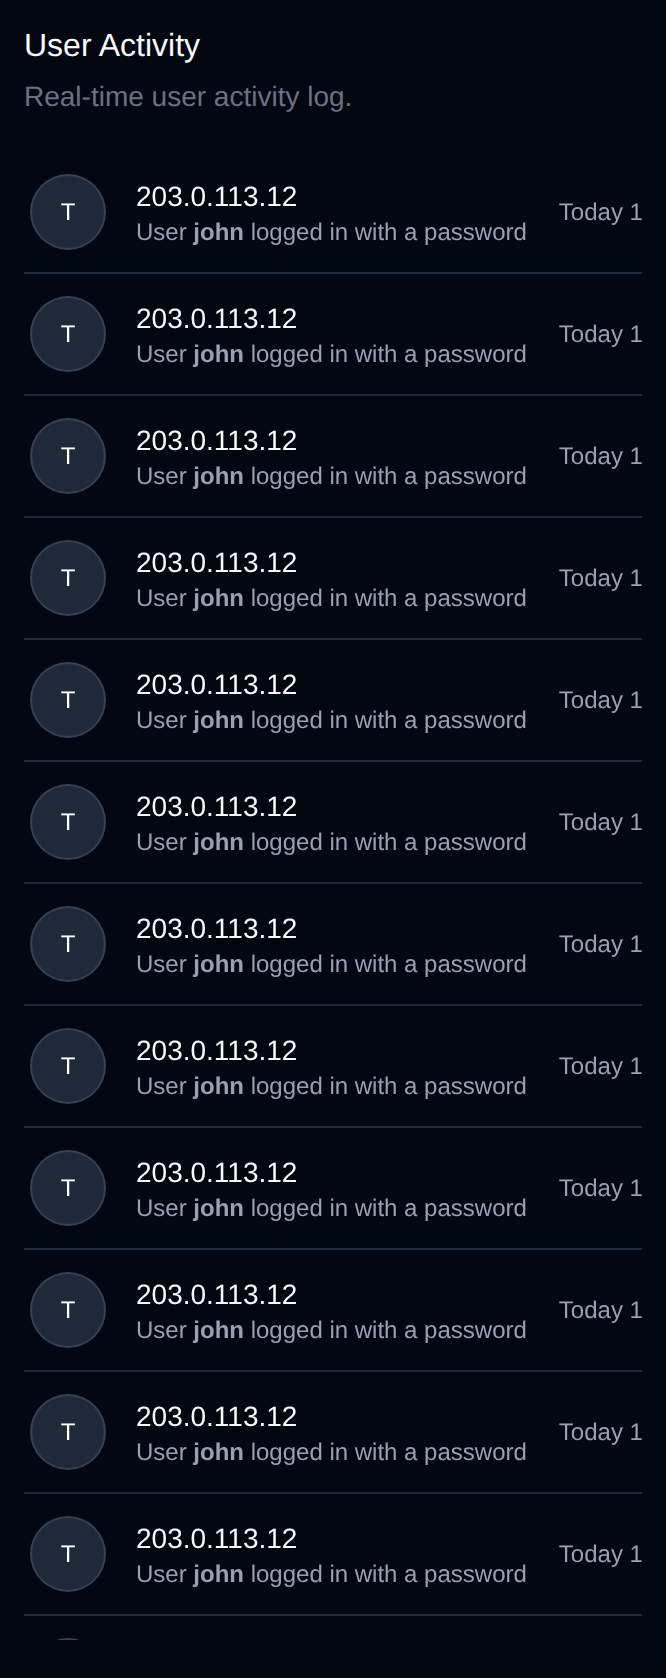
- User Activity widget: Displays real-time combined activity log of all OpenPanel users.
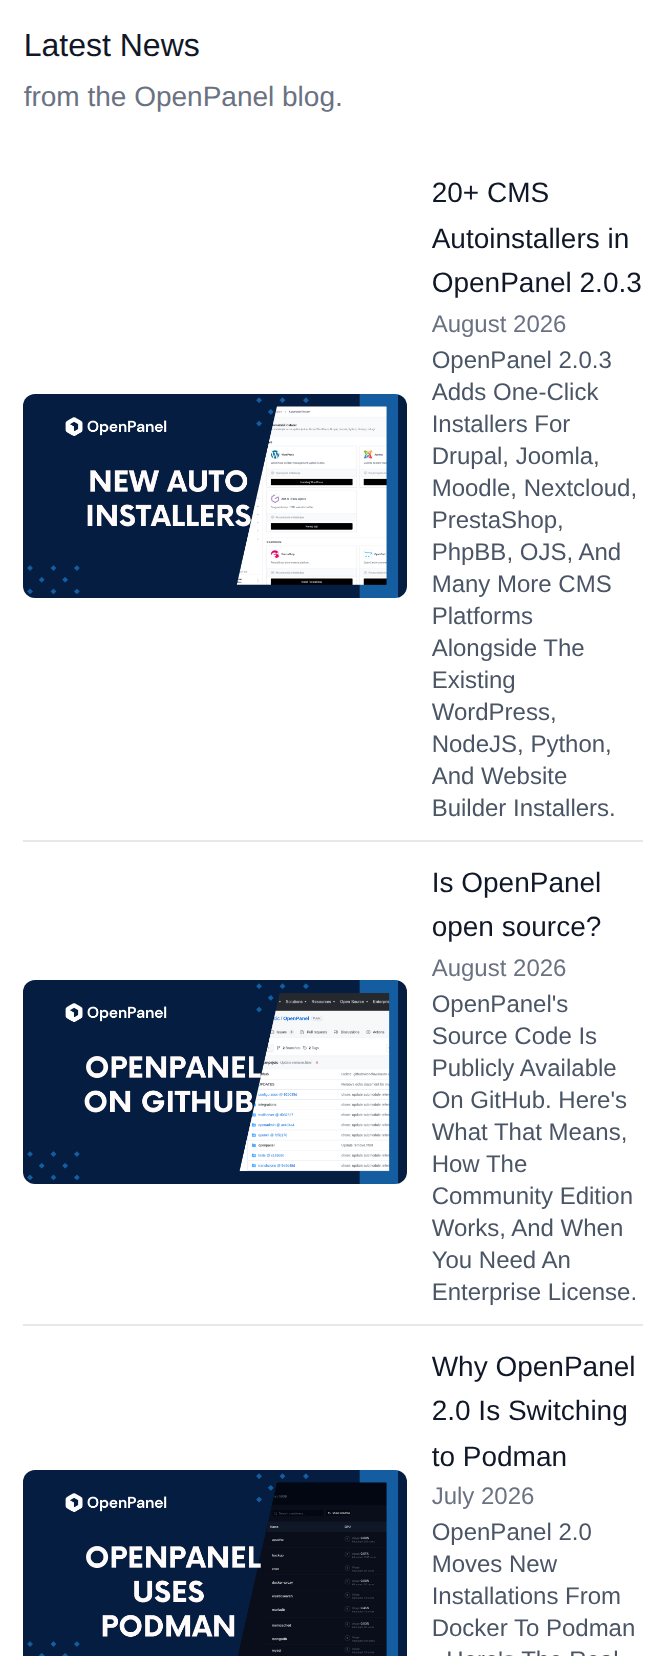
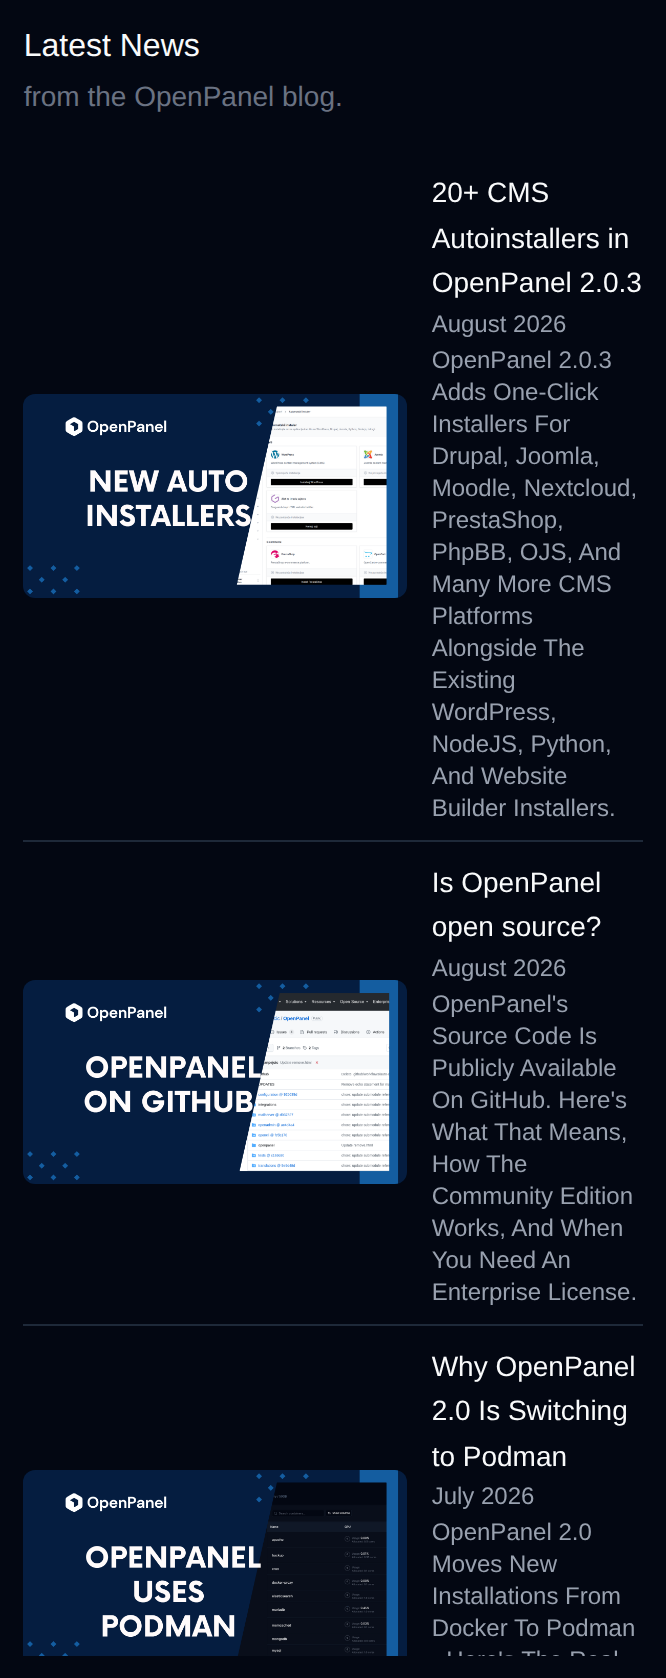
- Latest News widget: Displays blog articles from the OpenPanel blog.
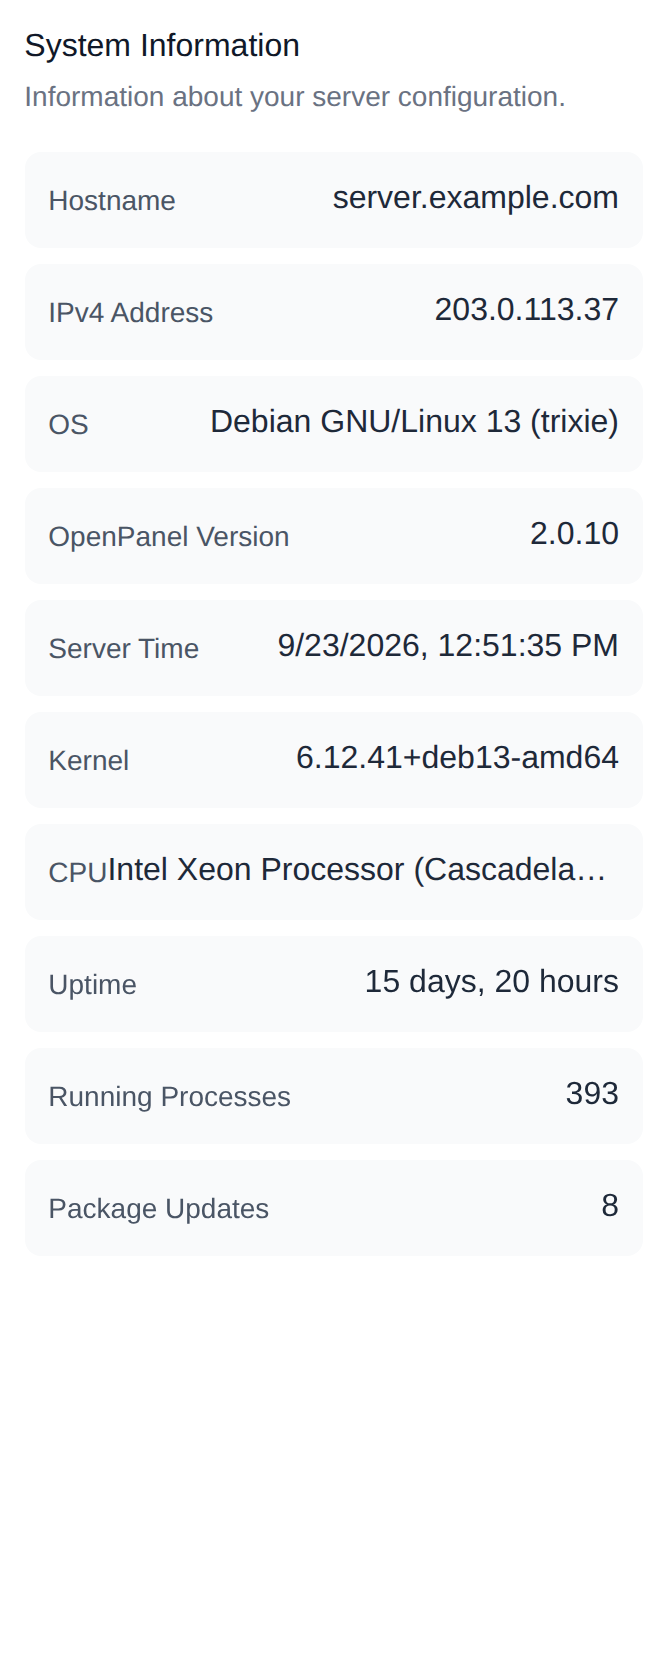
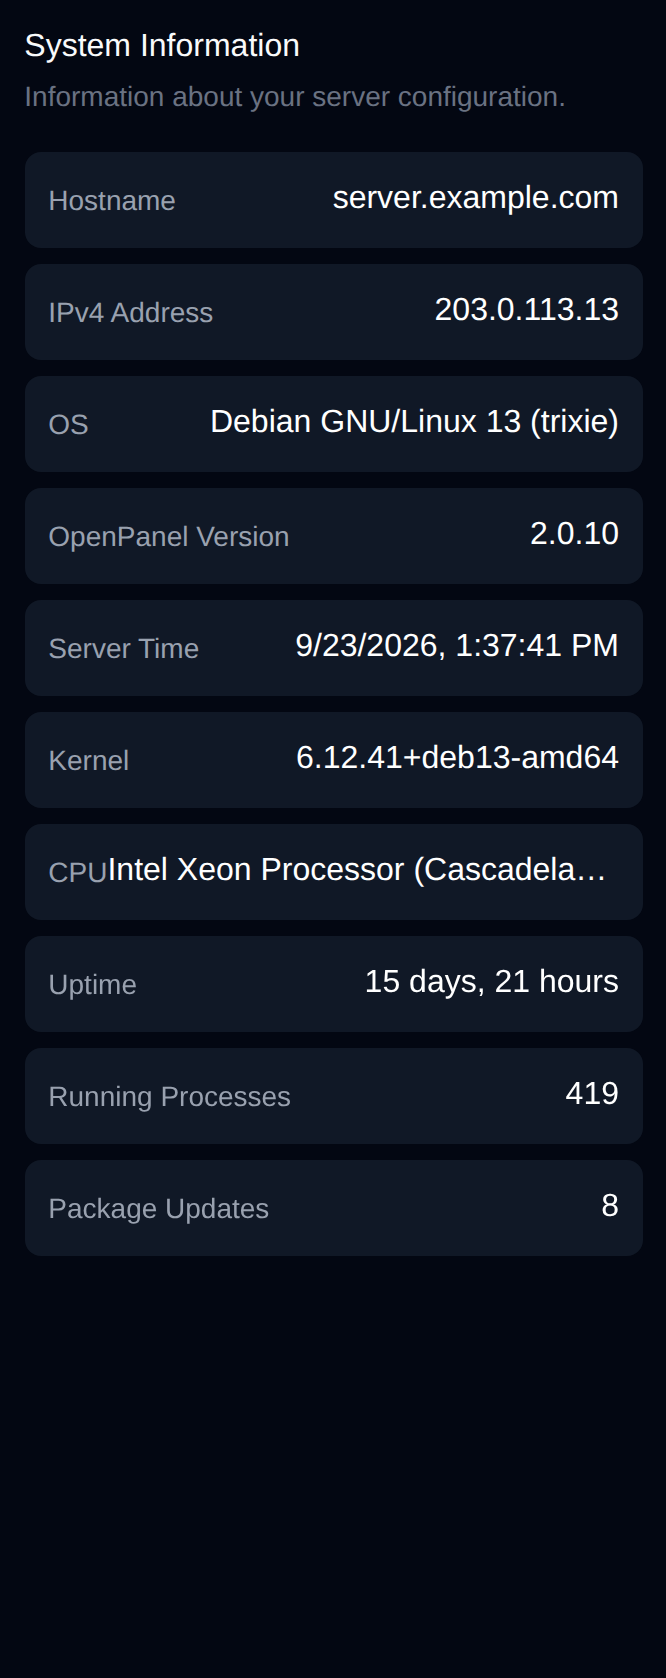
- System Information widget: Displays Information about your server configuration: Hostname, IPv4 address, OS, OpenPanel version, Server Time, Kernel, CPU type, Uptime, Number of Running Processes and available Package Updates.
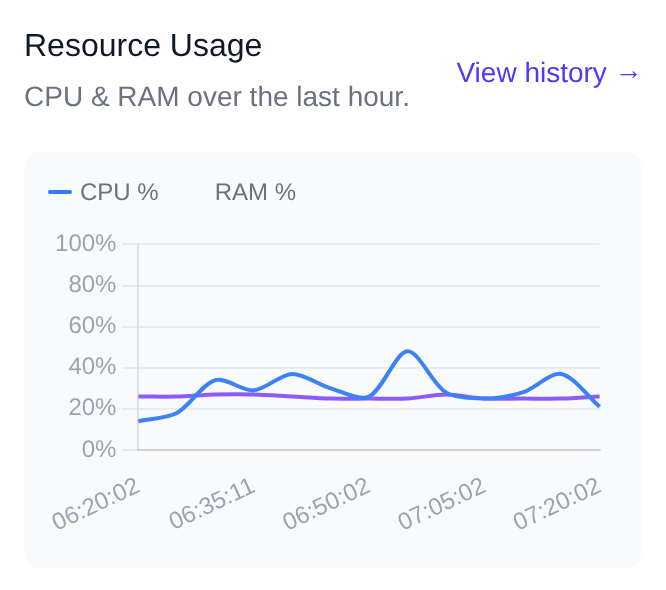
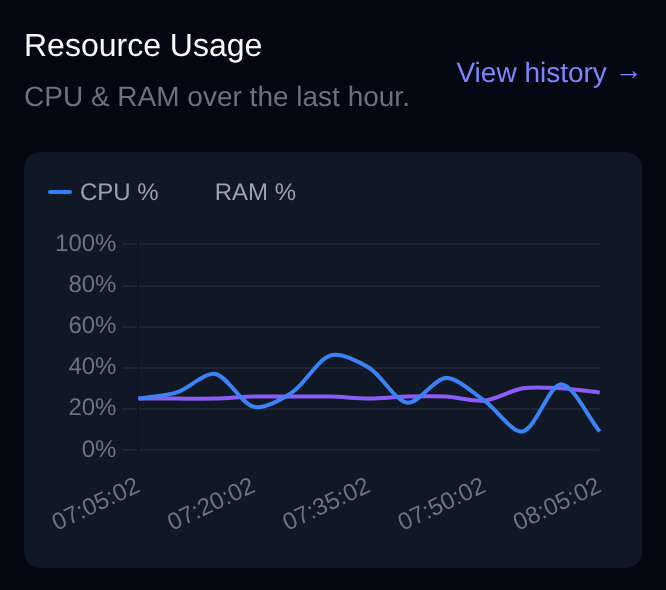
- Resource Usage widget: Displays a CPU % and RAM % chart for the last hour, with a link to view the full resource usage history.
Usage
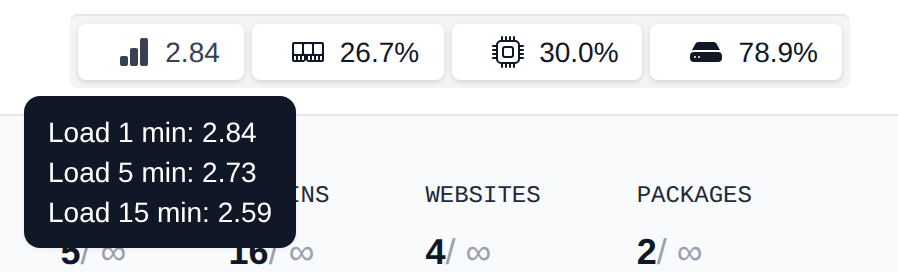
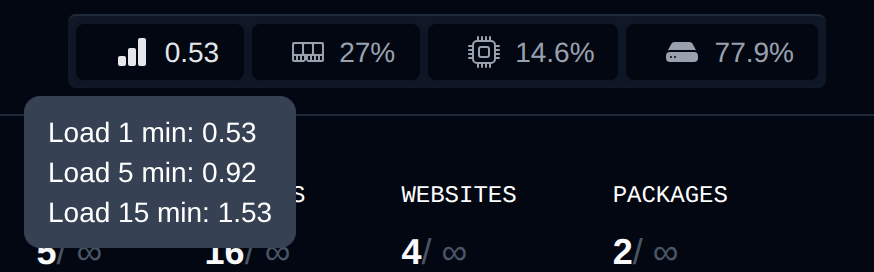
In the top-right corner of every page in OpenAdmin, administrators can monitor real-time resource usage, including Load, Memory, CPU, and Disk.
Hovering over each metric provides detailed information:
- Load – Average system load over 1, 5, and 15 minutes
- Memory – Usage of physical memory and SWAP
- CPU – Usage per CPU core
- Disk – Usage per disk partition
User Activity
The User Activity widget provides a combined list of latest actions from all OpenPanel users (their activity logs).
Latest News
The Latest News widget displays news from OpenPanel Blog.
System Information
The System Information widget displays information about your server:
- Hostname
- IPv4 address
- OS
- OpenPanel version
- Server Time
- Kernel version
- CPU model
- Uptime
- Number of running processes
- Available Package updates
Resource Usage
The Resource Usage widget displays a chart of CPU % and RAM % usage over the last hour. Click View history to open the full Resource Usage history page (Server > Resource Usage).
Tasks
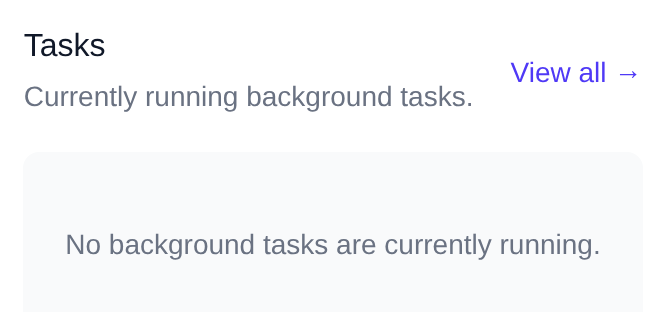
The Tasks widget lists background tasks that are currently running on the server. Click View all to open the full list of tasks.
Found a Bug
By default, every page in both the OpenPanel and OpenAdmin UIs includes a "Found a bug? Let us know" link at the bottom. This link allows users to report issues directly to our GitHub Issues page and includes basic information to help reproduce the problem.
For the OpenPanel UI, administrators can disable this link by going to Settings > OpenPanel Settings and toggling off the "Display link to report bugs" option.
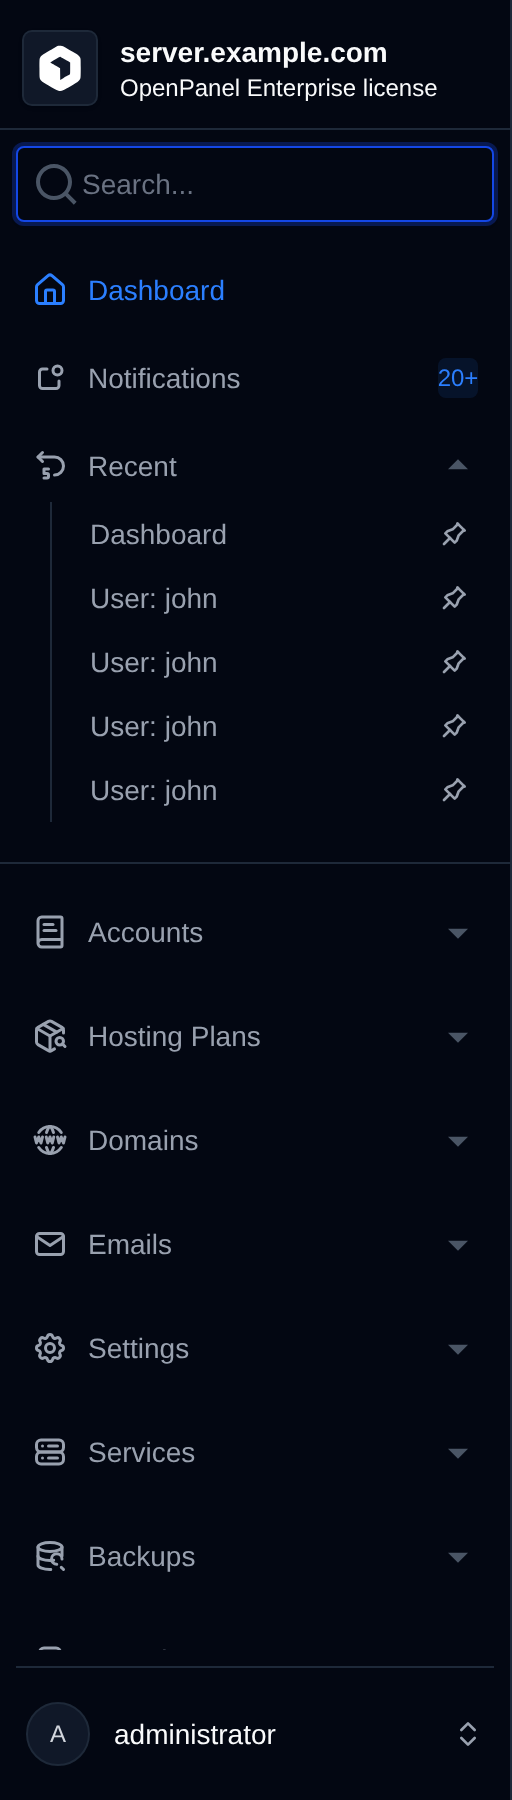
Dark Mode
To enable Dark Mode, click your username in the bottom-left corner and select the Moon icon. To switch back to Light Mode, click the Sun icon.
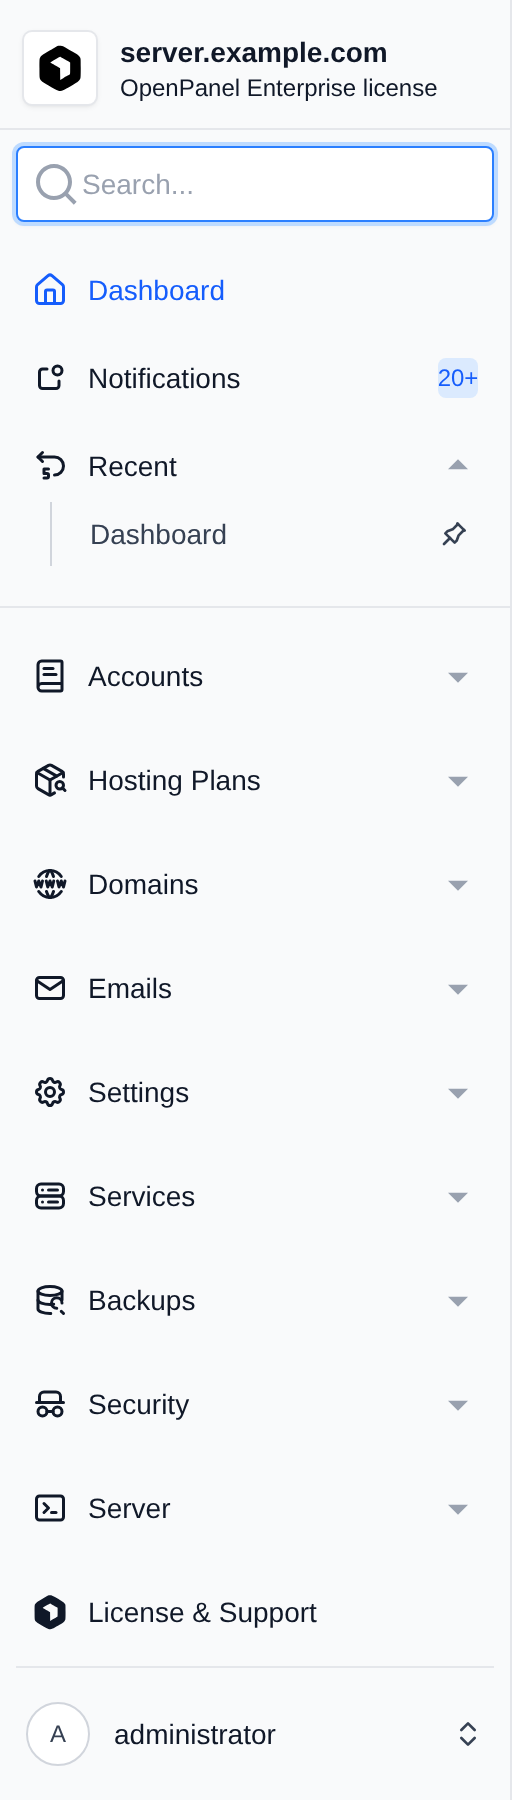
Menu
OpenAdmin menu lists all available options in the OpenAdmin interface. Simply click on a menu item to open it.
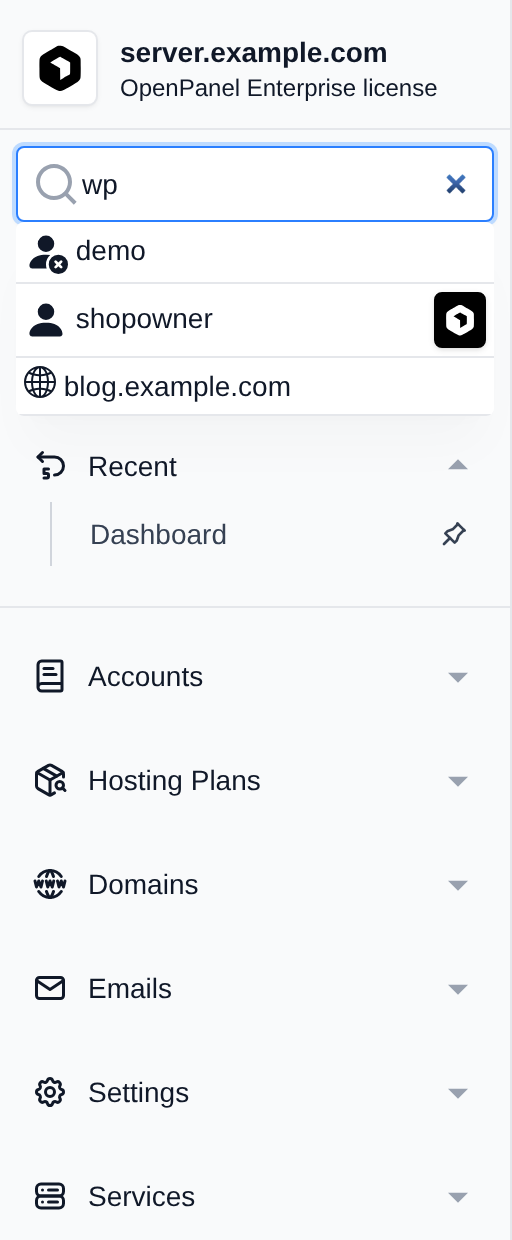
Search
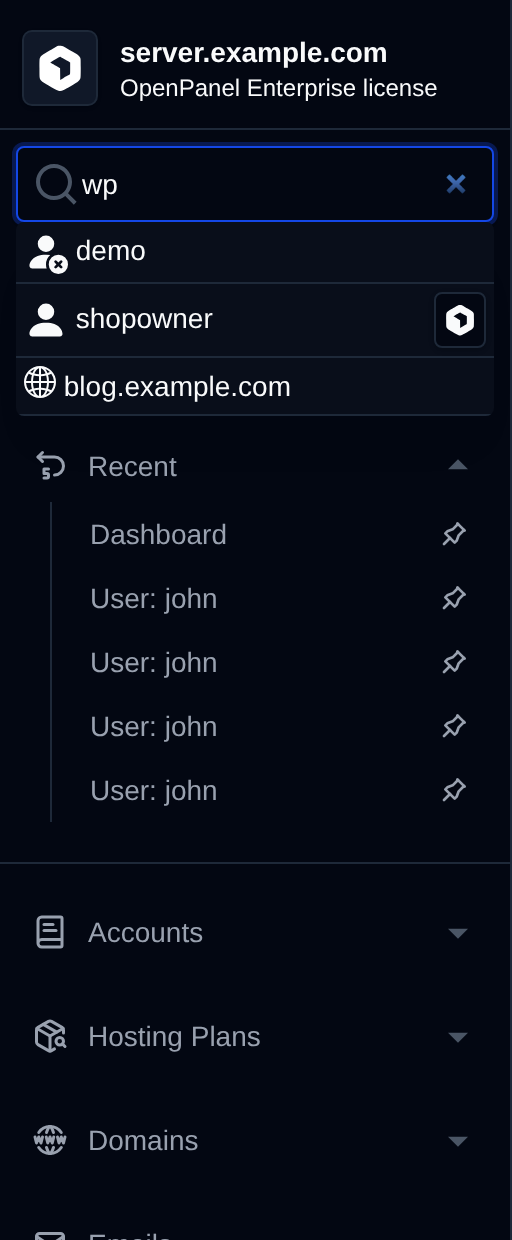
Search returns:
- OpenPanel users with login link for their OpenPanel
- Website/Domains of users
- Features/pages in the Admin interface
Keyboard Shortcuts
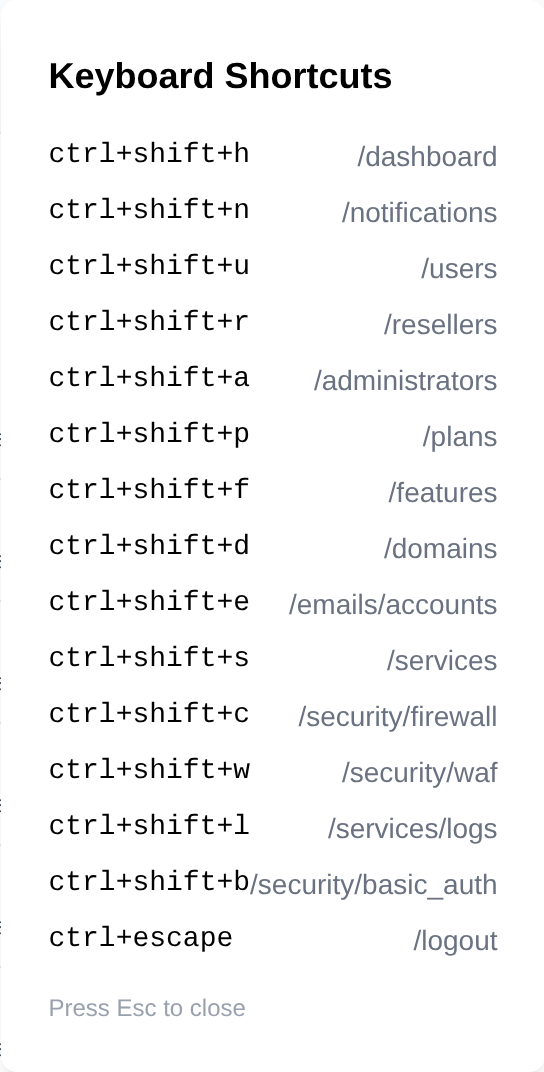
OpenAdmin UI can be navigated using keyboard shortcuts: view documentation.
Press Ctrl + K (or Cmd + K on macOS) on any page to show the list of available shortcuts:
Logout
To log out of the OpenAdmin account, click your username in the bottom-left corner and select 'Sign out' option.