Dashboard
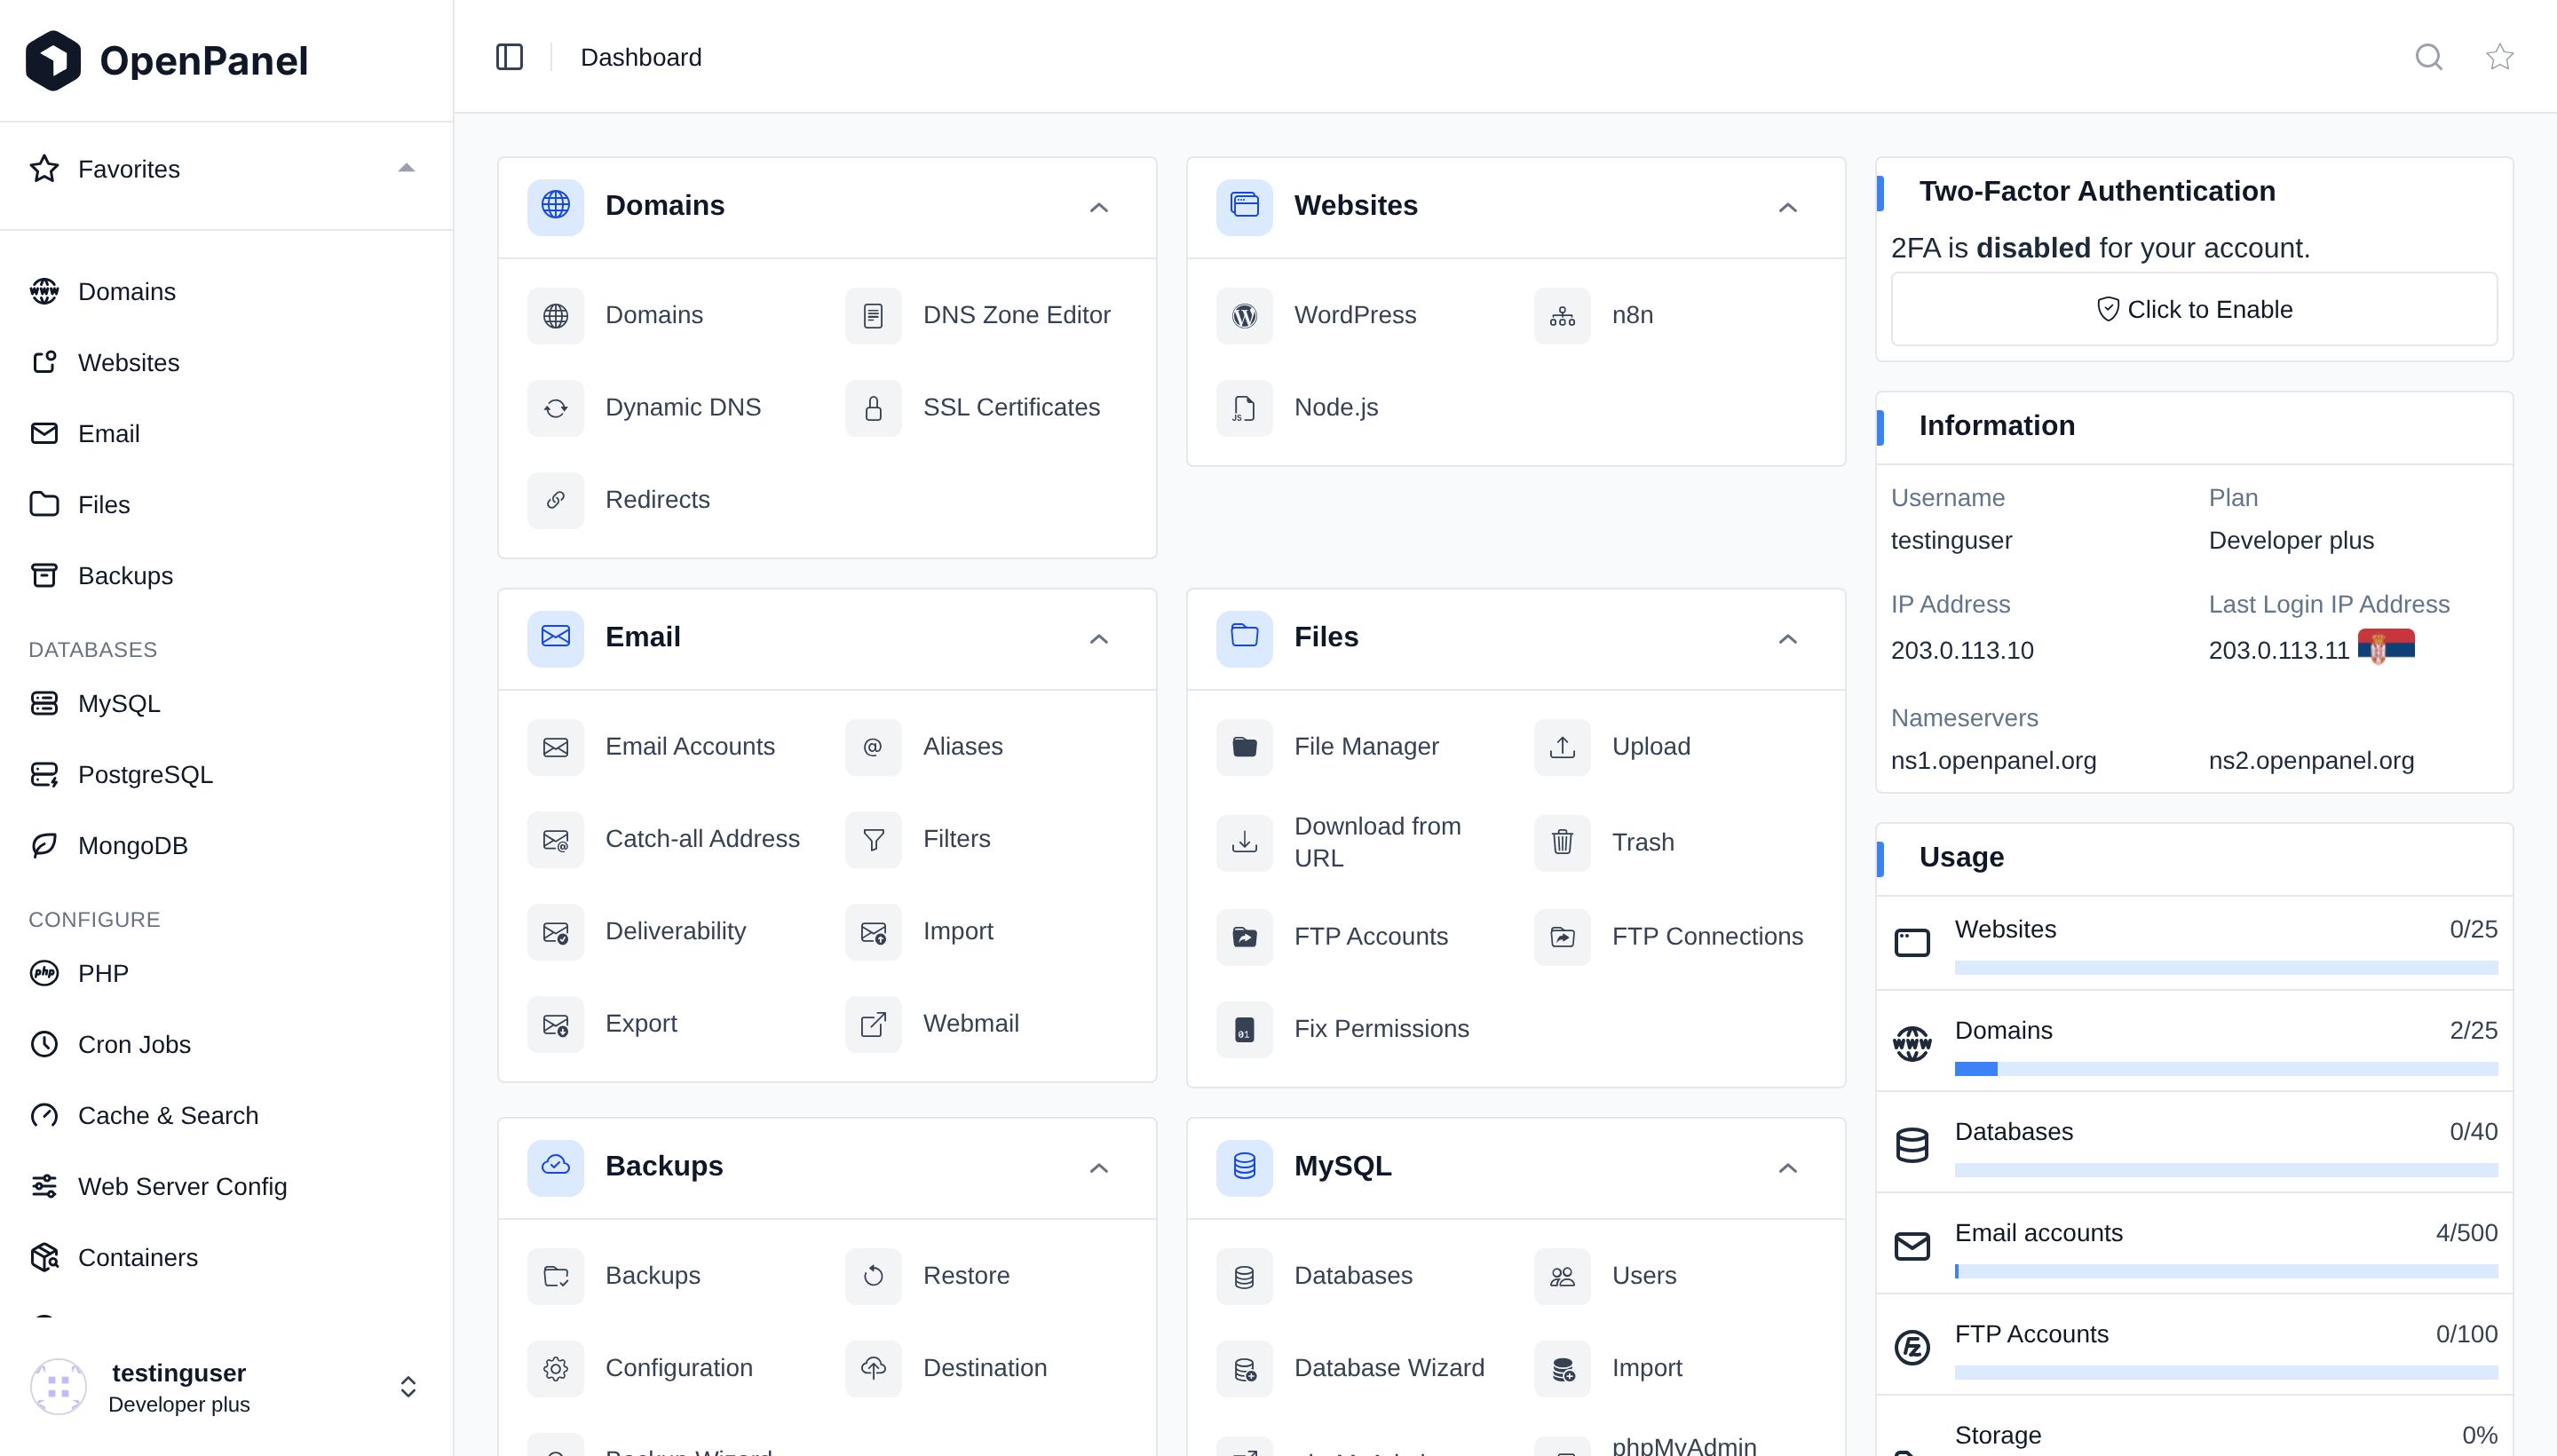
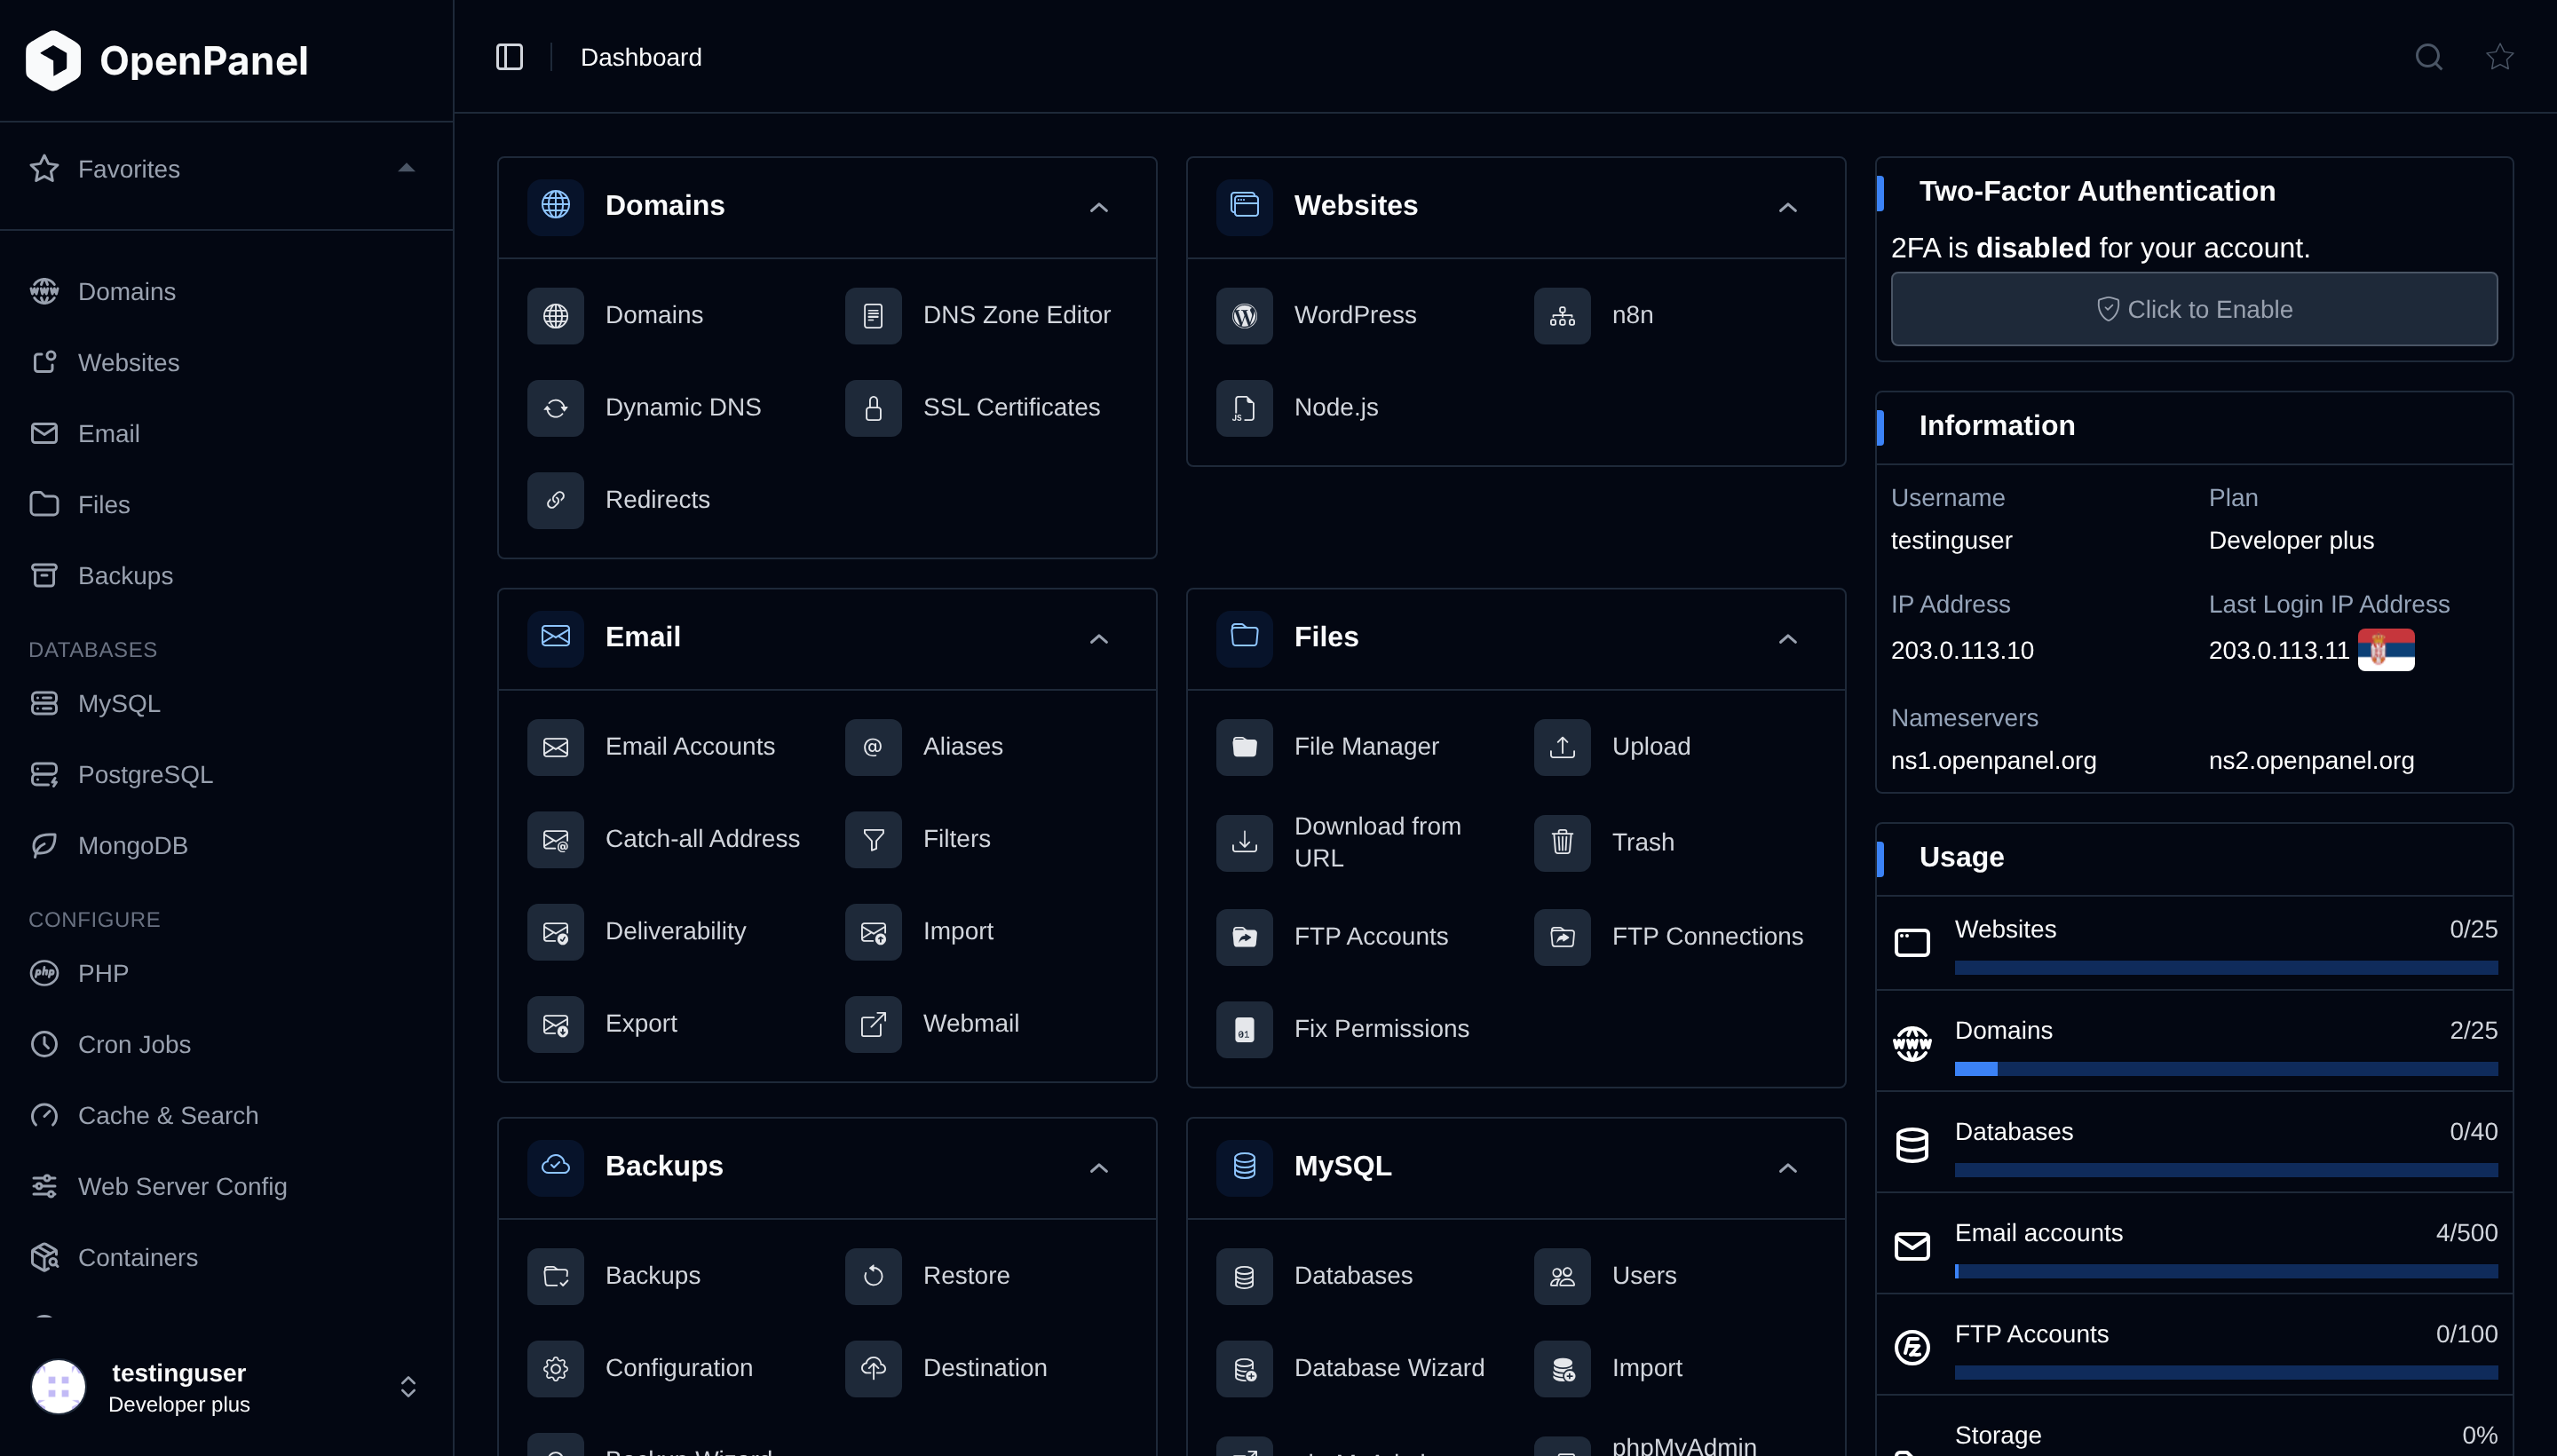
The OpenPanel interface is the central hub of your user account, providing access to all available tools, usage information, and notifications.
The OpenPanel dashboard interface is divided in two sections:
- Features: listing all available options
- Widgets: 2FA, Information, Usage and How-to guides
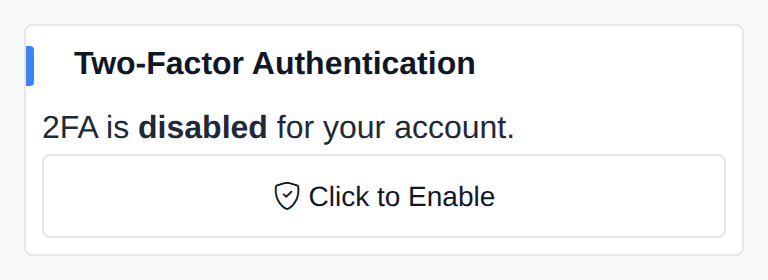
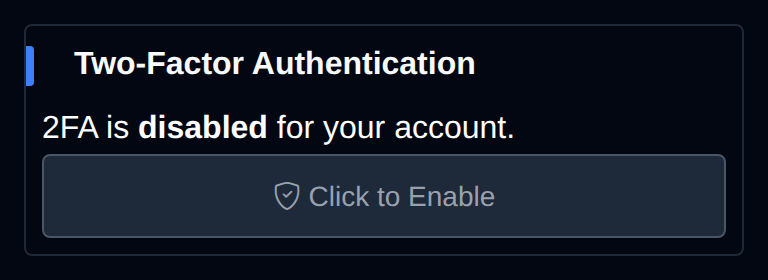
Two-Factor Authentication
This widget shows whether Two-Factor Authentication is enabled for your account. If it isn't, click Click to Enable to set it up.
Information
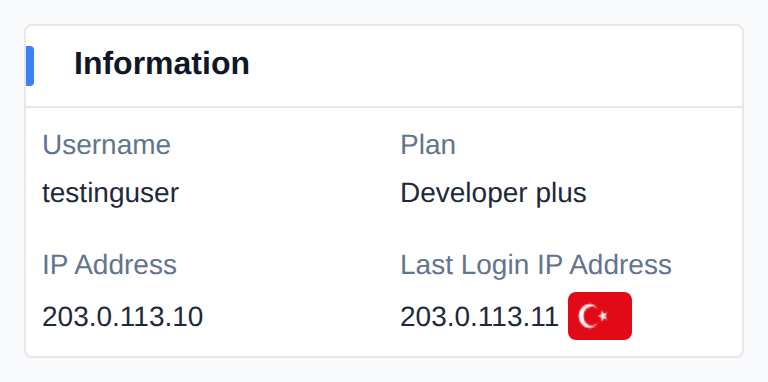
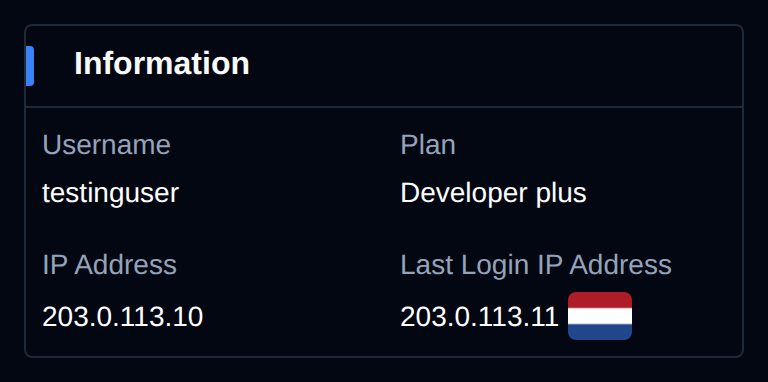
This section displays general server information:
- Username
- Plan name
- Shared or Dedicated IP address
- Last login IP address
- Nameservers (if configured)
Usage
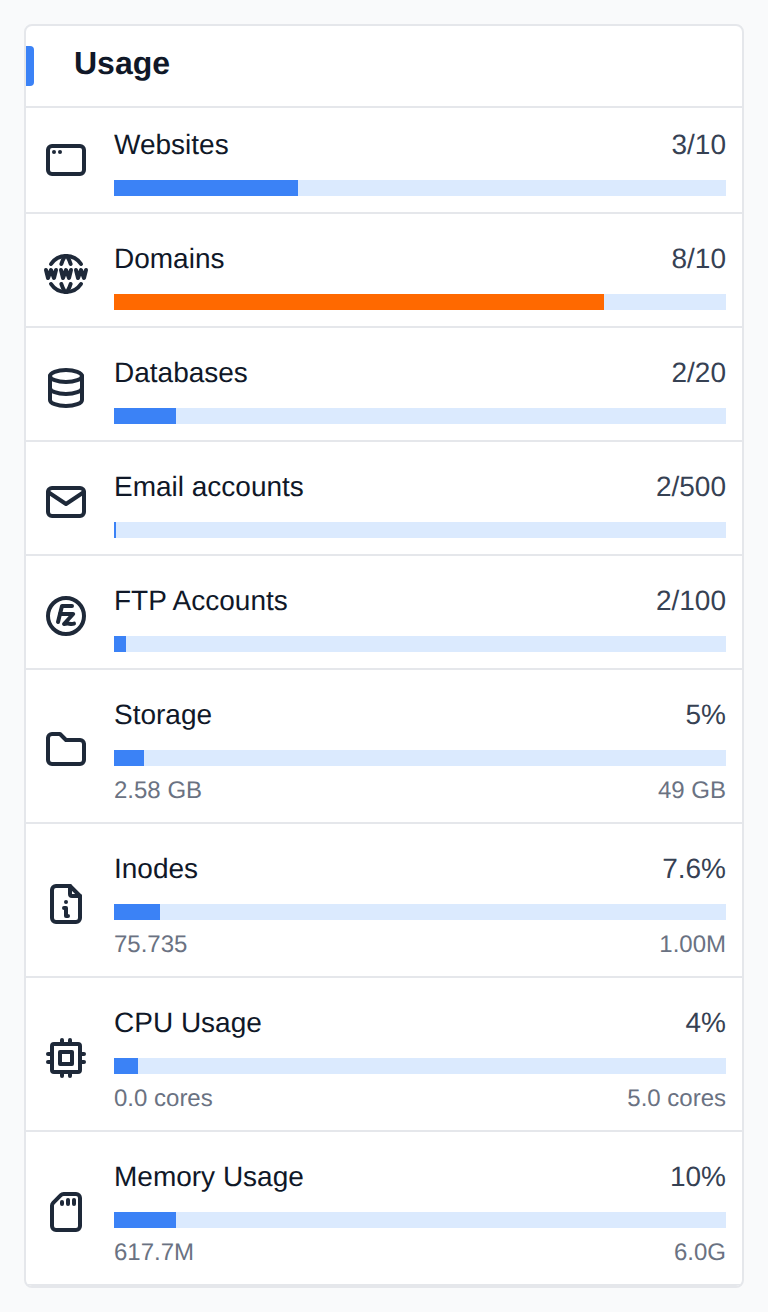
This widget displays your current usage against your plan's limits, for each item enabled on your plan:
- Websites
- Domains
- Databases (MySQL and/or PostgreSQL)
- Email accounts
- FTP accounts
- Storage
- Inodes
- CPU Usage
- Memory Usage
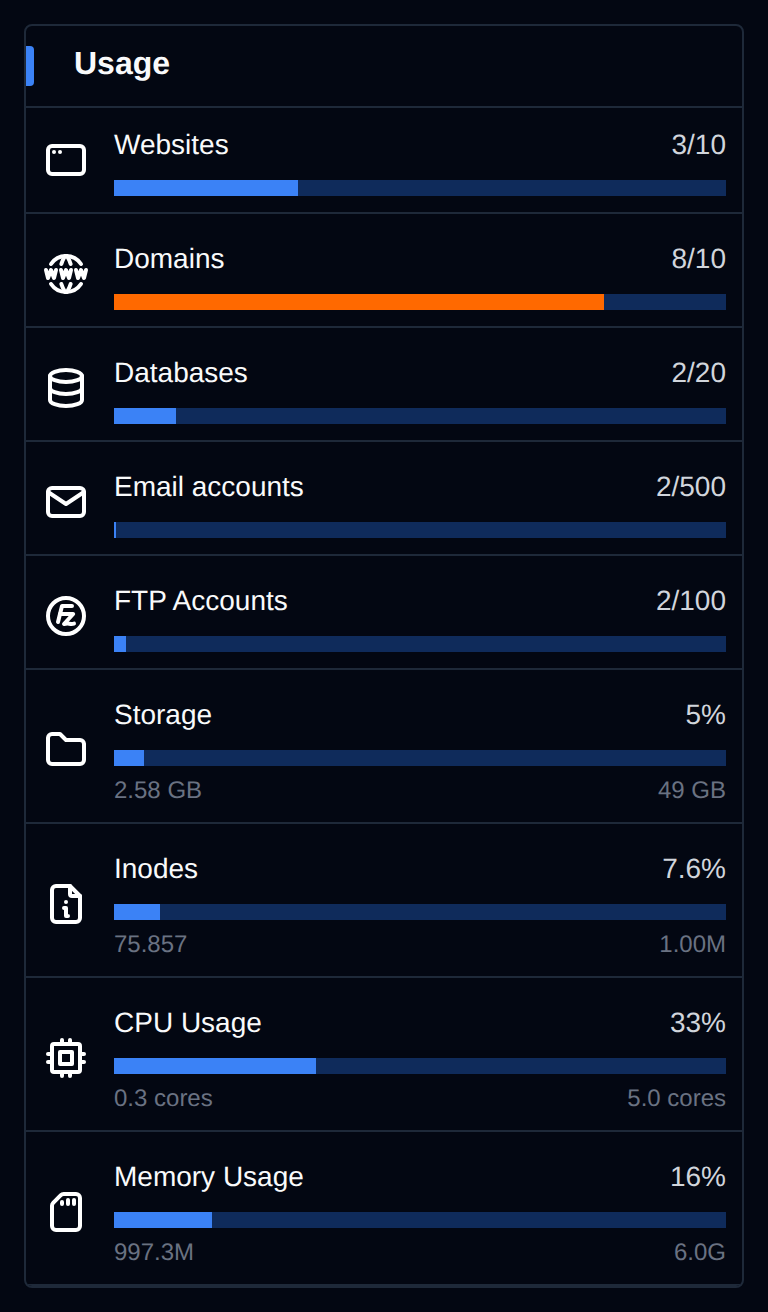
CPU and Memory usage are fetched live from the server. For a more detailed, dedicated view of CPU and RAM usage (and historical charts), see the Resource Usage and Resource Usage History pages under the Advanced menu, if enabled by your Administrator.
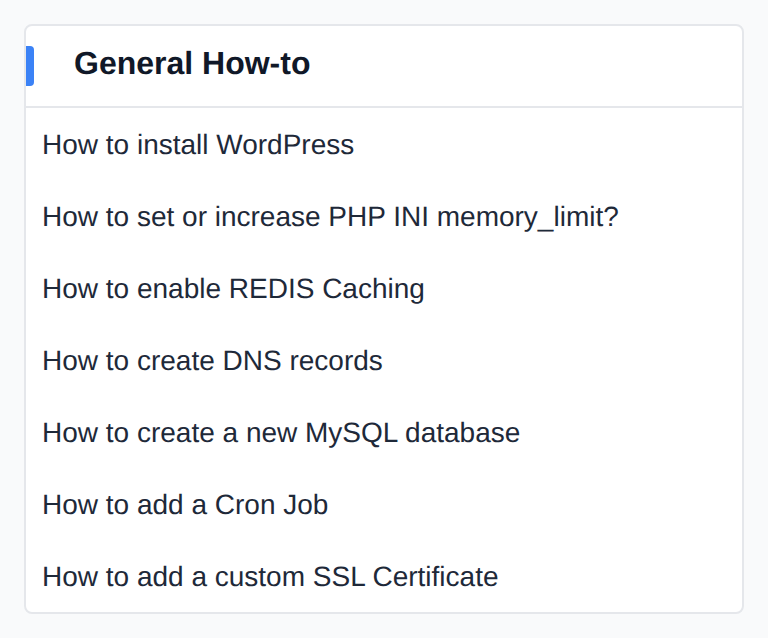
How-to Guides
If enabled by the Administrator, the How-to guides section will display links to Knowledge Base articles configured by your hosting provider, or to the official OpenPanel documentation by default.
Favorites
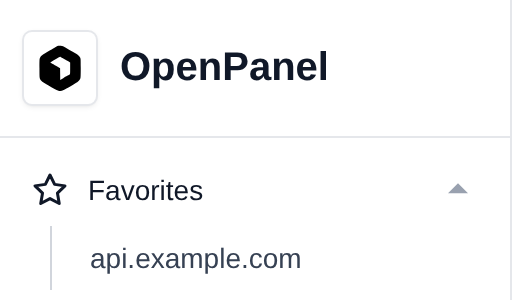
When Favorites feature is enabled by Administrator, users can bookmark up to 10 pages from the OpenPanel interface. These pages will appear in the sidebar menu. To add a page to favorites, simply left-click the star icon in the top-right corner of any page. To remove a page, right-click the same icon.


Saved pages are listed under Favorites at the top of the sidebar:
Services
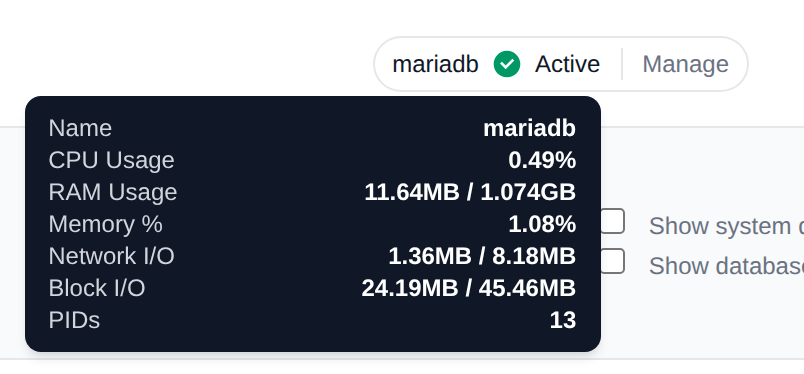
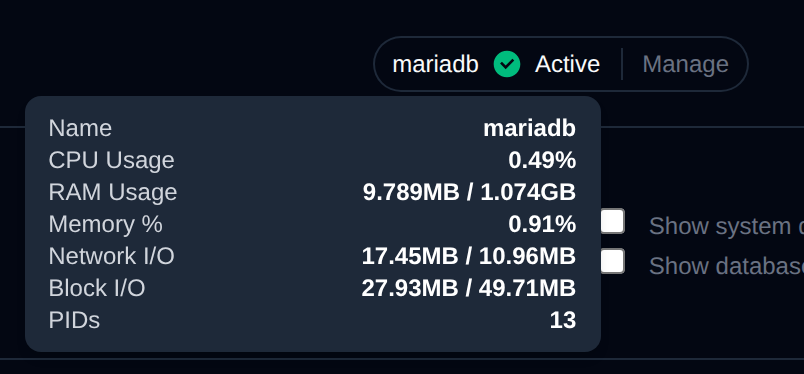
A service badge with the service name and its status is shown in the top-right corner of the header, but only on pages that manage a container, such as MySQL, Redis or Cron Jobs. Other pages don't show it.
Hover over the service name to see live information about its container:
- Name
- CPU Usage
- RAM Usage
- Memory %
- Network I/O
- Block I/O
- PIDs
If the Services feature is allowed on your plan, a Manage link next to the badge opens the service's page. If only the Docker feature is allowed, Manage opens the service on the Containers page instead.
Search
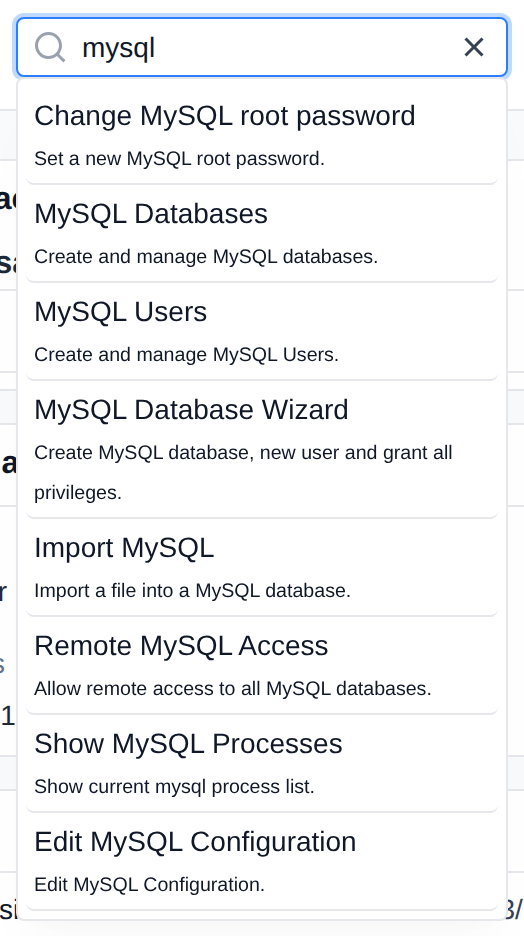
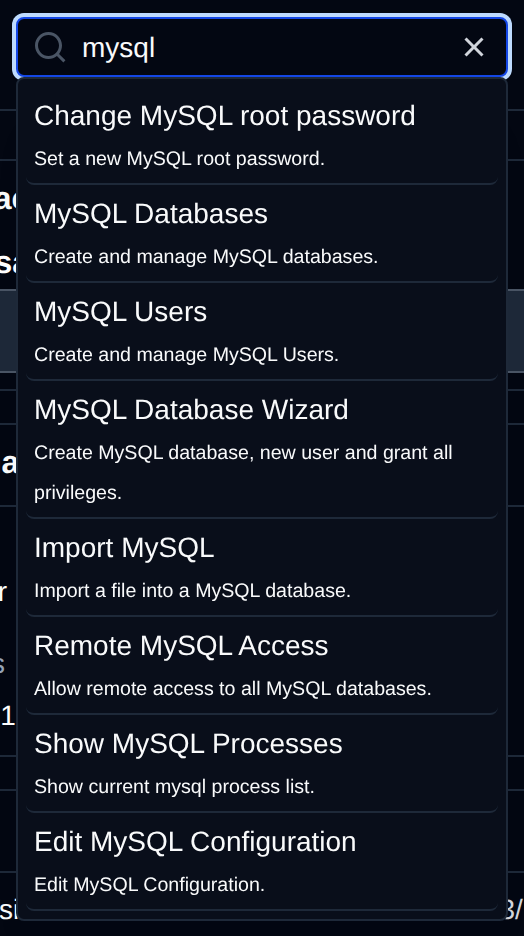
Click the magnifying glass icon in the top-right corner of the header to open the search box. It searches across pages/features, files and folders, websites, domains, email accounts, FTP accounts, containers, services, cron jobs, and MySQL/PostgreSQL databases and users. Results are limited to what's enabled on your plan — some entity types (databases, domains, emails, FTP, containers, services, websites, cron jobs) additionally require an Enterprise license.
Getting Started Tour
On first login, a short guided tour highlights the main areas of the interface. You can skip it at any time; it won't reappear once dismissed.
The tour can be started from the last step of the Onboarding wizard.