Resource Usage
Resource Usage provides real-time information about your server's CPU, RAM, and other performance metrics. You can monitor your server's resource consumption and access historical data to make informed decisions.
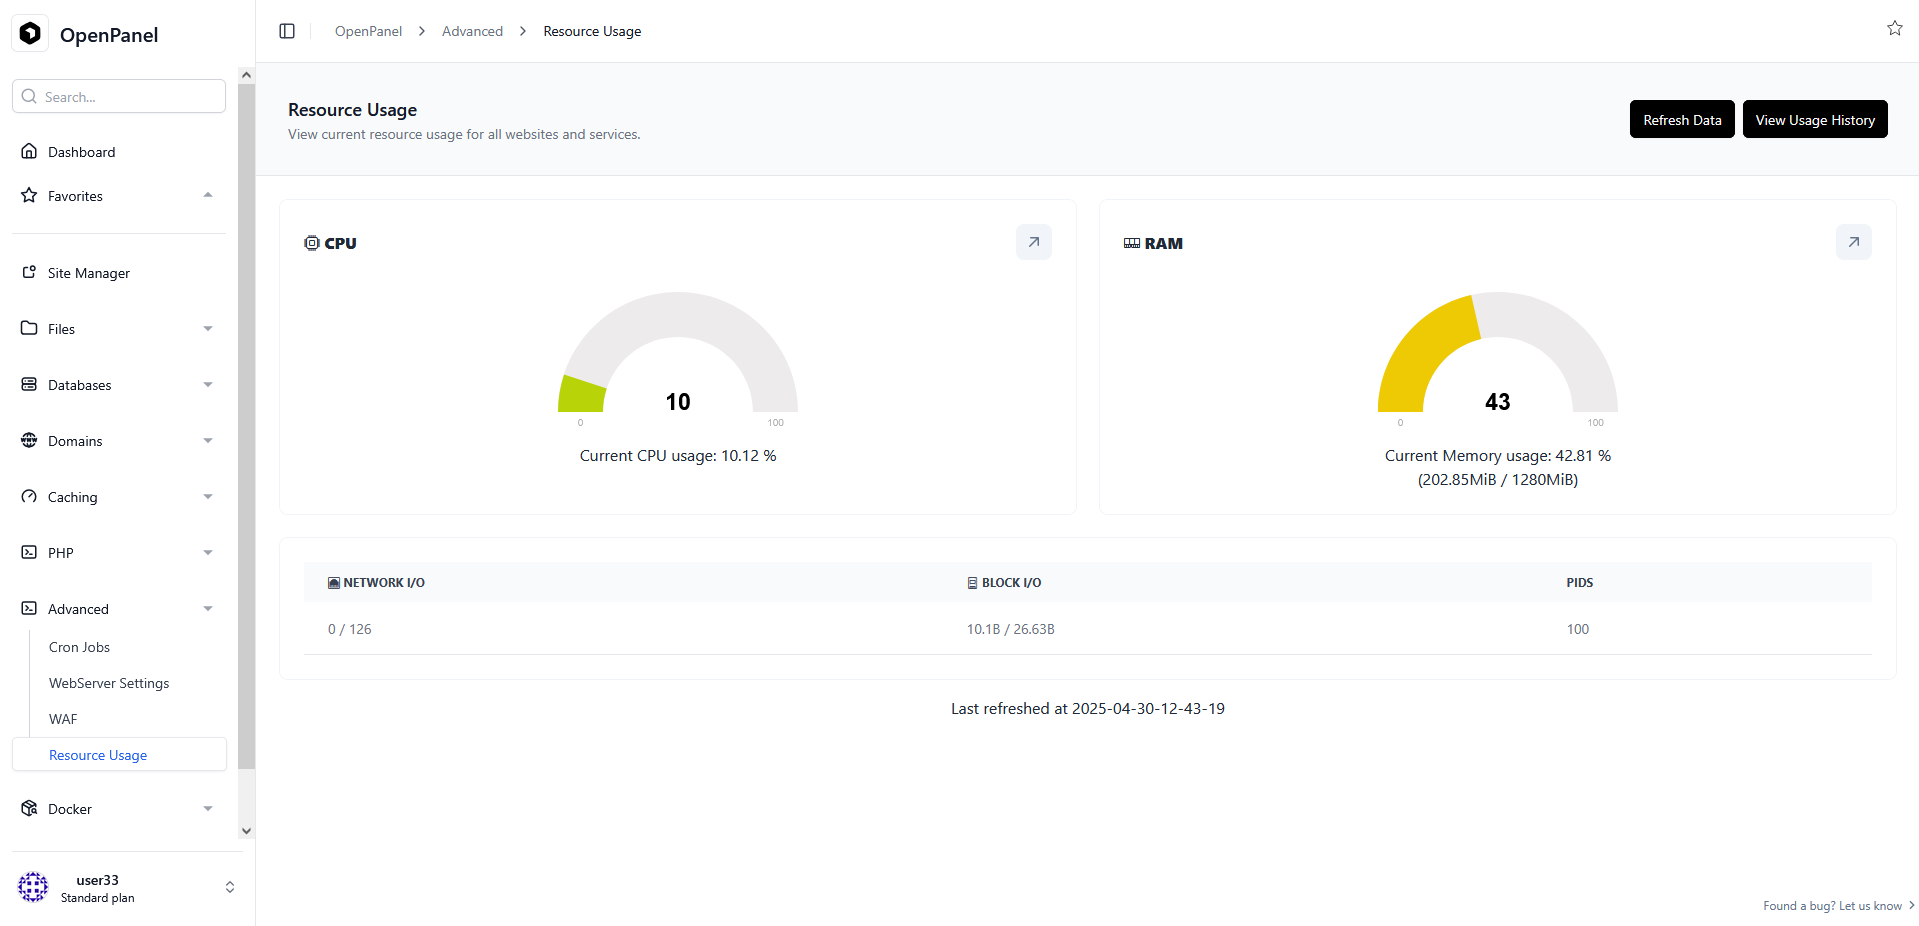
CPU Usage
The CPU Usage section displays the current CPU usage of your server. It provides essential details about the percentage of CPU utilization and allows you to track historical CPU usage.
Current CPU Usage
The gauge shows the current CPU usage as a percentage. It helps you quickly assess how much of your CPU resources are in use.
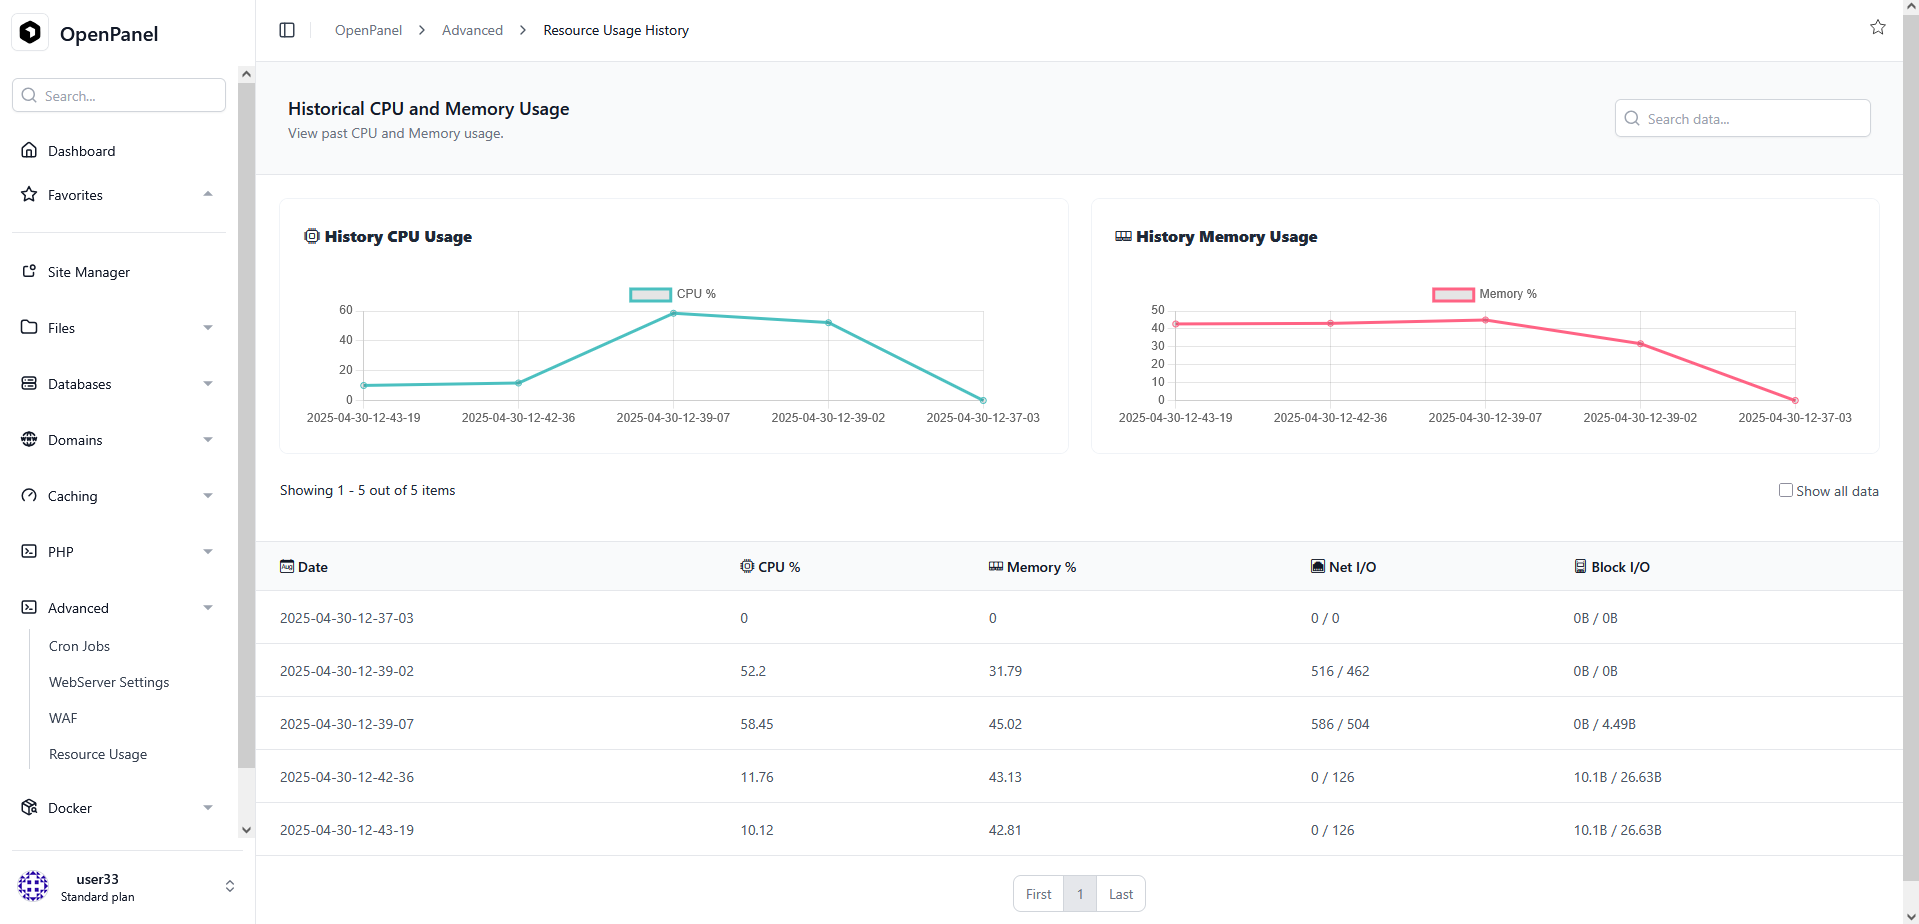
Historical Data
To view past CPU usage data, click the Arrow button on the top right corner of the CPU gauge block.
This will open the Historical Resource Usage page that allows you to track historical CPU and memory usage, enabling you to make informed decisions and analyze your server's performance over time.
RAM Usage
The RAM Usage section provides insights into your server's memory consumption. It displays the current memory usage, memory limit, and historical data.
Current RAM Usage
The gauge illustrates the current RAM usage, including the percentage used and the actual memory usage in relation to the memory limit.
- Current Memory usage
- Memory Usage
- Memory Limit
Historical Data
Access historical RAM usage data by clicking the Arrow button on the top right corner of the RAM gauge block.
This will open the Historical Resource Usage page that allows you to track historical CPU and memory usage, enabling you to make informed decisions and analyze your server's performance over time.
Network I/O
The Network I/O section provides insights into network input and output for your server.
Block I/O
Monitor block input and output operations in the Block I/O section.
Process IDs (PIDs)
The PIDs section displays the number of running processes on your server.
By monitoring and managing your server's resource usage effectively, you can ensure optimal performance and make informed decisions to address any resource-related challenges.