Sentinel
Sentinel is an AI-powered service that autonomously monitors your server, makes decisions, and sends alerts to the notifications center and emails.
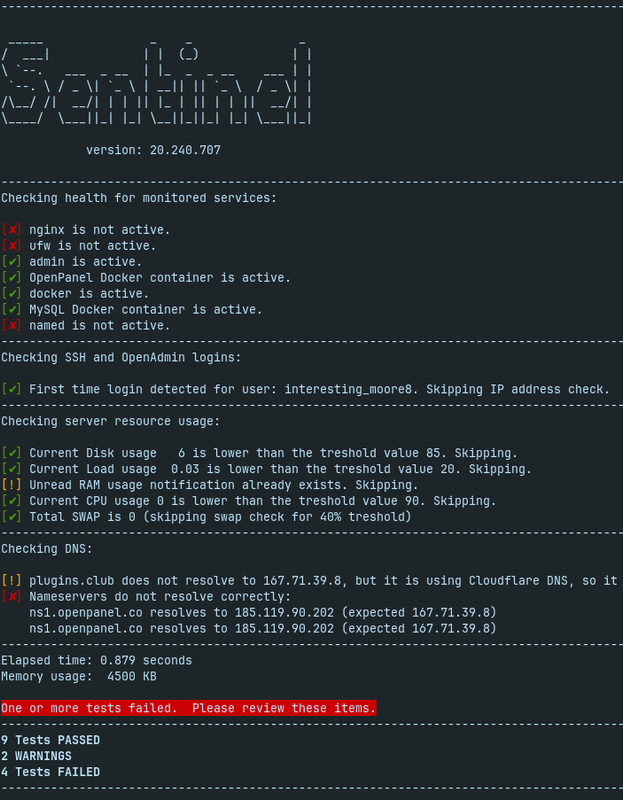
Using the command you can check current system health and get suggestions on improving configuration:
opencli sentinel
Example output
# opencli sentinel
--------------------------------------------------------------------------------
  Sentinel - OpenPanel server health monitor
--------------------------------------------------------------------------------
Checking services:
[✔] openpanel is active and responding.
[✔] admin is active.
[✔] caddy is active and responding.
[✔] podman.socket is active.
[✔] MariaDB container active and responding.
[✔] csf is active.
[✔] phpmyadmin container is active.
[✔] No OOM errors detected.
--------------------------------------------------------------------------------
Checking traffic:
[✔] No unusual traffic detected on web ports (80|443).
--------------------------------------------------------------------------------
Checking logins, resources, and DNS...
[✔] No new logins to OpenAdmin.
[✔] No active SSH sessions.
[✔] Disk 41% < threshold 85%
[✔] Load 0.42 < threshold 20.
[✔] RAM 38% < threshold 85%
[✔] CPU 7% < threshold 90%
[✔] No SWAP configured.
[✔] All nameservers resolve to local IPs.
[✔] No dead user containers found (checked in 2s).
[✔] Mail queue 0 < threshold 500
--------------------------------------------------------------------------------
All Tests Passed!
--------------------------------------------------------------------------------
19 PASS  0 WARN  0 FAIL
--------------------------------------------------------------------------------
Resolved issues
When a check passes again, Sentinel marks the matching unread notifications for that issue as read and resolved in OpenAdmin > Notifications, where they show a Resolved after … badge, since they no longer need admin attention. For example, if the OpenPanel container was reported as not running and is running on the next check, the OpenPanel container not running! notifications are marked as read. This applies to service and container checks (including recovery after a restart), disk, load, RAM, CPU, SWAP, web traffic, domain and nameserver checks. Event notifications like new logins, SSH logins, OOM kills and reboots are left unread.
It also sends a Resolved: <title> message by email/webhook saying when the issue was first reported, so admins who got the alert also learn that it's over.
Example output
# opencli sentinel
...
Checking services:
[✔] openpanel is active and responding.
[✔] Issue resolved, marked notification as read: OpenPanel container not running!
...
What gets emailed
- Alerts need admin attention. They are logged as unread with a critical or warning severity and sent by email/webhook. Service alerts say what failed, what Sentinel tried, which command to check it with, and include the last log lines. If the same alert is detected again while it's still unread, its count and last seen time are updated instead of adding a new notification or sending another email. Disk, load, RAM and SSH login checks are skipped entirely while their alert is unread, so no new crashlog is generated either. This only lasts 24 hours from when the alert was first reported: after that, an unread alert no longer blocks new ones, so a new notification (and crashlog for load) is logged and emailed again.
- Info entries are for things Sentinel already fixed on its own, like restarting a stopped container. They are logged as already read for history and are not emailed. If the same thing happens again within 24 hours of the first entry, that entry's count, last seen time and message are updated instead of adding a new row, so a container that keeps crashing shows up once.
- All alerts from one run are sent as one email and one webhook. If several email addresses or webhook URLs are set, each of them gets it. With a single alert the subject is its title, with more it's N notifications from Sentinel on <hostname> and the body lists them all. In the email each notification is shown with its severity.
- The webhook is sent as JSON with a
textfield for Slack and acontentfield for Discord, which is cut to 2000 characters since Discord rejects longer messages.
Load, CPU and RAM only alert after they stay over the threshold for 2 checks in a row (about 10 minutes with the default cron), so short spikes don't trigger alerts. CPU usage is measured over 1 second.
Example output
# opencli sentinel
...
[!] CPU 96% > threshold 90% (1/2 checks), alerting if it stays high.
...
OOM kills are read from the kernel log with journalctl -k, at most once an hour, covering everything since the previous check (the last hour on the first run after a reboot). Both kills inside a container's memory limit and system-wide out of memory kills are counted, and the alert lists each killed process with its user, PID, container name (or short ID if the container no longer exists), memory used, time and whether it hit the container's memory limit or the server ran out of memory (at most 10, the rest are counted). Kills inside a user's rootless containers are matched to that user by the cgroup path, since the kernel reports them with a subuid.
Example output
# opencli sentinel
...
[✘] 2 user process(es) killed by OOM since 2026-10-02 14:05
    - user stefan: php-fpm8.3 (pid 4321, container php-fpm-8.3, 512 MB) at 2026-10-02 14:31, container memory limit
    - user stefan: php-fpm8.3 (pid 4388, container php-fpm-8.3, 498 MB) at 2026-10-02 14:47, container memory limit
...
User containers
Once an hour Sentinel starts any stopped containers for root and every non-suspended user. Some user containers only run when they're needed, and Sentinel starts or stops them to match:
cronanddocker-proxyrun whilecrons.inihas at least one enabled job (fully commented-out, disabled jobs don't count).backupanddocker-proxyrun whilebackup.envhas a remote backup destination set.docker-proxyis left running while a backup fromopencli docker-backupis in progress.mysqlormariadb(the one set inMYSQL_TYPEin the user's.env) runs while the user has at least one database. Databases are counted from folders in the user's MySQL data volume, so Sentinel never connects to the user's MySQL to check. If there are no databases and the account is older than 2 hours, it's stopped. It's started again when the user opens the Databases page. The type the account doesn't use is never started, since both share the same data volume.
Containers Sentinel stopped this way aren't counted or emailed to the user as restarted.
Example output
# opencli sentinel
...
stefan: stopping cron (not needed)
stefan: stopping docker-proxy (not needed)
stefan: stopping mariadb (not needed)
john: starting required container mysql
...
[!] Started/restarted 0 container(s) for root and 1 container(s) across 1 user(s) in 3s. Per user: john: 1.
...
Rate limits
When Visitors blocked by rate limit is turned on in OpenAdmin > Settings > Notifications (ratelimit=yes in /etc/openpanel/openadmin/config/notifications.ini, off by default), Sentinel checks every 6 hours whether visitors got 429 Too Many Requests from the request rate limits. It reads the last 6 hours of every domain's access log with opencli domains-ratelimit stats --all --hours 6 --json.
If any domain had blocked requests, a Rate limit reached on N domain(s) warning lists up to 10 domains with how many requests were blocked and the IP blocked the most. Each domain's owner who turned on Visitors blocked by rate limit on their Notifications page also gets an email about their own domains.
Example output
# opencli sentinel
...
[!] Rate limits blocked visitors on 2 domain(s) in the last 6h.
stefan: notified about rate limited domains.
...
# opencli sentinel
...
[✔] Rate limit check skipped (last run 1h 12m ago).
...
Disk cleanup
When disk usage on / is over the du threshold, Sentinel tries to free space on its own, safest step first, and stops as soon as the disk is back under the threshold:
- Vacuum the systemd journal to 500MB (
journalctl --vacuum-size=500M). - Clear the package manager cache (
apt-get clean,dnf clean alloryum clean all). - Delete old logs: crashlogs and reports in
/var/log/openpanel/admin/older than 7 days, update logs in/var/log/openpanel/updates/older than 30 days, rotated archives in/var/log(*.gz,*.1,*.old, notwtmp/btmp) older than 7 days, and Sentinel/OpenCLI temp files in/tmpolder than a day. - Shrink every log in
/var/logthat uses more than 1GB to its last 100MB, in place so Caddy and other services keep writing to it. The journal,lastlog,wtmpandbtmpare skipped. - Prune unused podman data older than 24 hours for the server and every user, and remove images from the shared image store
/var/lib/containers/shared-storagethat no container of root or any user uses and that weren't pulled in the last 24 hours. If a container list can't be read, no images are removed. - Empty the Trash of every user, same as Empty Trash in the File Manager (
/home/USERNAME/.local/share/Trash, the.trash_restorelist is kept but emptied). Trash folders that are symlinks are skipped. This is last because it's the only step that deletes user data.
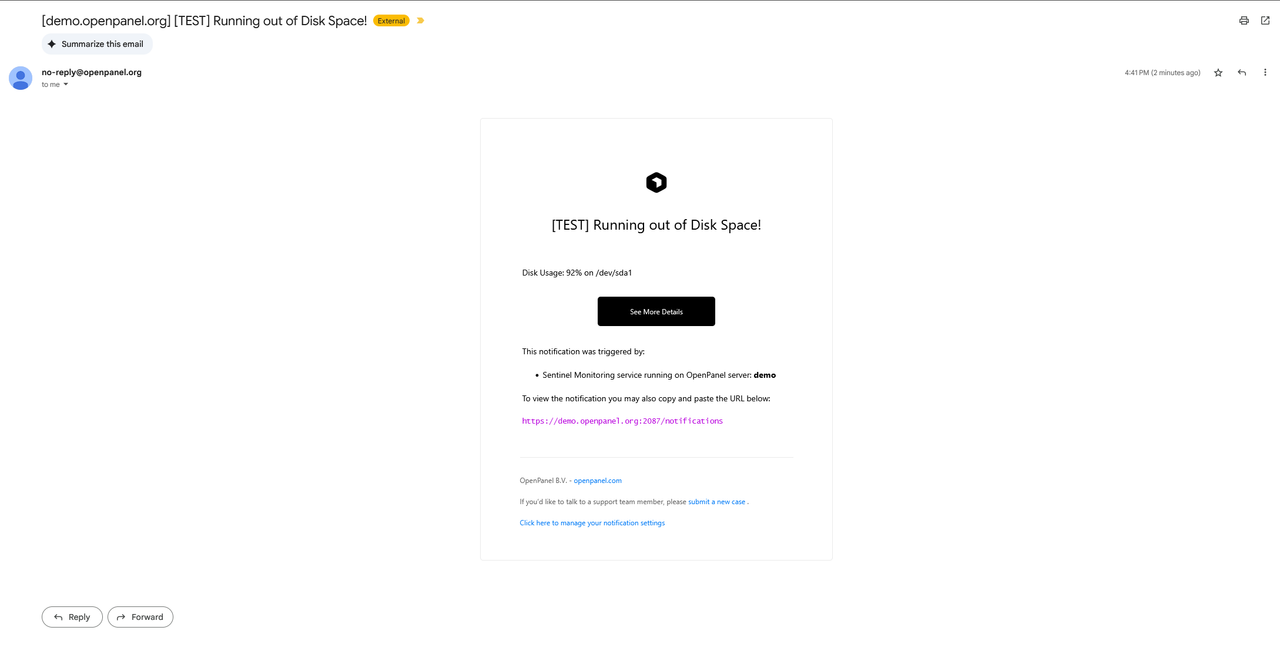
The Running out of Disk Space! alert then says how much each step freed, where the disk is now, which logs were shrunk, which images were removed and whose Trash was emptied, e.g. Disk was 91%, Sentinel freed 3.1GB and it is now at 82% (threshold 85%). Cleaned up systemd journal: 1.2GB, package cache: 300MB, old and rotated logs: 1.6GB. Stopped once the disk was under the threshold. If the disk is still over the threshold after every step, it also suggests du -xh / --max-depth=2 | sort -rh | head to find what is using the space. The cleanup runs at most once every 24 hours, until then only the alert is sent.
Example output
# opencli sentinel
...
[!] Disk was 91%, sentinel freed 3.1GB, disk is now at 82%. Cleaned up systemd journal: 1.2GB, package cache: 300MB, old and rotated logs: 1.6GB. Stopped once the disk was under the threshold.
...
# opencli sentinel
...
[✘] Disk was 93% > threshold 85%, cleanup freed 1.1GB and it is still at 92%. Cleaned up systemd journal: 200MB, package cache: 0B, old and rotated logs: 100MB, logs over 1GB: 0B, unused podman data and images: 300MB, users' Trash: 512MB. Removed 1 unused image(s) from the shared store: docker.io/library/redis:7.4. Emptied the Trash of 1 user(s): stefan (512MB).
...
Top users
High load, CPU and RAM alerts name the 3 users using the most CPU (or RAM for the RAM alert), read from each user's user-UID.slice cgroup, e.g. Top users: stefan (45% CPU, 1.2GB RAM, 3% IO wait), pejcic (12% CPU, 800MB RAM, 0% IO wait). CPU is the share of all server cores over one second and IO wait is the some avg10 value from the slice's io.pressure. Each user is already capped by their plan's CPU and RAM limits on that slice, so Sentinel only reports them and doesn't throttle anyone.
Blocking abusive IPs
An IP with more than max_conn_per_ip connections to port 80 or 443 is blocked with csf -td for 60 minutes, and CSF unblocks it on its own after that. If CSF isn't installed, the alert says the IP was not blocked. Sentinel never blocks IPv6 addresses, IPs in the SSH whitelist from OpenAdmin > Settings > Notifications, private ranges, the server's own IPs, IPs in /etc/csf/csf.allow or /etc/csf/csf.ignore, or Cloudflare ranges (read from trusted_proxies in the Caddyfile). The High traffic from alert says for every IP whether it was blocked, and if not, why.
On a possible SYN flood, Sentinel also turns on SYN cookies (net.ipv4.tcp_syncookies=1) if they're off, until the next reboot, and says so in the Possible SYN flood alert.
Example output
# opencli sentinel
...
Checking traffic:
[✘] High connections from 203.0.113.5 on port 443: 812
    [→] blocked for 60 min
    [→] Domain hit: example.com
[✘] High connections from 104.16.5.5 on port 443: 640
    [→] not blocked: Cloudflare
    [→] Domain hit: example.com
...
# opencli sentinel
...
[✘] Possible SYN flood on :443 — 1500 in SYN_RECV
    [→] Sentinel turned on SYN cookies (net.ipv4.tcp_syncookies=1) until the next reboot.
...
Mail queue
Sentinel checks the queue of the openadmin_mailserver container on every run. When more than 500 emails are waiting, not counting ones on hold, a Large mail queue! alert lists the 5 senders with the most queued emails and the OpenPanel user each one belongs to. A sudden big queue from one mailbox usually means its password was stolen or a website form is abused by spammers.
Sentinel also puts all queued emails of the top sender on hold if it has at least 250 queued and belongs to a local account. Bounces and relayed mail are never held. Held emails are not delivered until you release them with opencli email-server unhold ALL (or one QUEUE_ID), or delete them with opencli email-server delete QUEUE_ID, see them with opencli email-server queue. Once the queue is back under the threshold, the alert is marked as resolved.
Example output
# opencli sentinel
...
[✔] Mail queue 3 < threshold 500
...
# opencli sentinel
...
[✘] Mail queue 650 > threshold 500. Sentinel put 600 email(s) from [email protected] on hold. Review them with: opencli email-server queue, then release them all with: opencli email-server unhold ALL or delete one with: opencli email-server delete QUEUE_ID.
...
Timeouts
So a hung podman command can't stop monitoring, every podman call Sentinel makes has a timeout, each check in the parallel part (logins, disk, load, RAM, CPU, SWAP, DNS, user containers, rate limits, mail queue) is stopped after 10 minutes, and the whole run is stopped after 15 minutes. A stopped check sends a Sentinel checks did not finish alert listing which checks hung, and a stopped run sends a critical Sentinel checks timed out! alert. Both are resolved on the next run that finishes in time. If a previous run is still going, the new one exits with Error: Another instance is already running.
Example output
# opencli sentinel
...
[✘] check_user_containers did not finish in 600s and was stopped.
...
Notifications log format
Notifications are stored in /var/log/openpanel/admin/notifications.log, one JSON object per line:
{"id":"1790279898a1b2c3","time":"2026-09-24 19:58:17","last_seen":"2026-09-24 20:08:17","count":3,"status":"unread","severity":"critical","category":"service","source":"sentinel","title":"OpenPanel container not running!","message":"Container openpanel was not running. Sentinel tried to start it, but it is still not running. ...","resolved_at":"2026-09-24 20:13:17"}
status:unreadorreadseverity:critical,warningorinfocategory:service,resources,security,dns,traffic,system,updateoractionsource:sentinel,update, or the action name for--actionnotificationscountandlast_seen: how many times the alert was detected while unread (or, for info entries, happened again) within 24 hours oftime, and when it was last detectedresolved_at: when Sentinel detected that the issue was gonedetails: optional structured data used by the Notifications page, e.g. RAM/CPU/disk usage and top processes, OOM kills, or a link to the crashlog or update log
Lines in the old text format (from before 2.0.12) are still shown on the Notifications page as plain entries.
While an OpenPanel update is running, Sentinel skips all checks, so it doesn't alert about or recreate containers the update is restarting. An update lock older than 30 minutes is ignored.
Example output
# opencli sentinel
--------------------------------------------------------------------------------
  Sentinel - OpenPanel server health monitor
--------------------------------------------------------------------------------
[!] OpenPanel update in progress, skipping checks until it finishes.
--------------------------------------------------------------------------------
Additional flags:
-
--startup- run the actions performed after a server reboot: start stopped containers for root and all users and send the reboot notification.User containers are started in stages so 50+ accounts don't all hit the disk at once after a reboot: up to half the CPU cores worth of users at a time (min 2, max 8), 2 seconds apart, and the next user waits (up to 60s) while IO pressure is above 40% or load is above 2x the cores. Regular 5-minute runs skip the user container check until the staged start is done.
Example output
# opencli sentinel --startup
root: starting openpanel_mysql (was: exited)
root: starting openpanel (was: exited)
root: starting caddy (was: exited)
...
50 users to start, staged (max 4 at a time, 2s apart, waiting on high IO/load)
[1/50] stefan: starting containers
stefan: starting nginx (was: exited)
stefan: starting mysql (was: exited)
[2/50] john: starting containers
john: starting apache (was: exited)
...
--report- send the Daily Usage Report email (if email alerts are enabled).--action=<name> --title=<title> --message=<message>- log a custom notification to OpenAdmin > Notifications (and email/webhook) if notifications are enabled for that action.
Example:
opencli sentinel --action=admin_api --title="OpenAdmin API is on" --message="API access is now on."
Example output
# opencli sentinel --action=admin_api --title="OpenAdmin API is on" --message="API access is now on."
[!] Notifications are disabled for action: admin_api
Nothing is printed when the notification is logged. The message above is shown only when notifications for that action are disabled in notifications.ini.
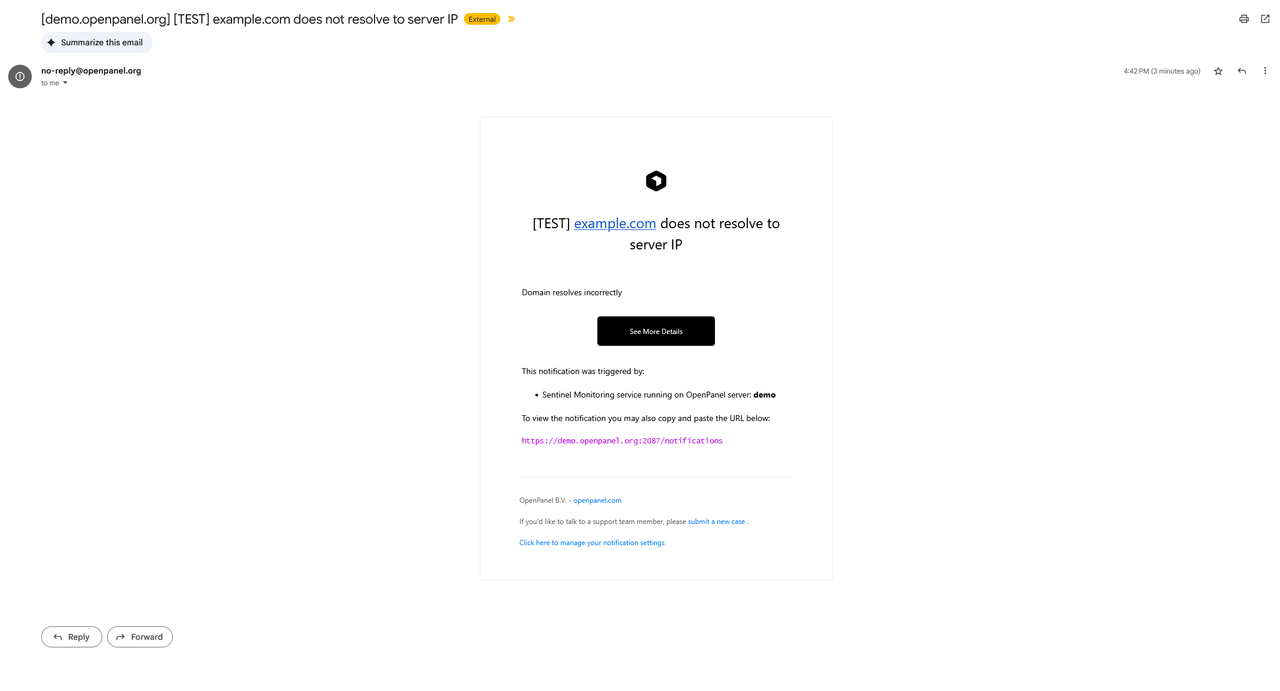
Example email notifications
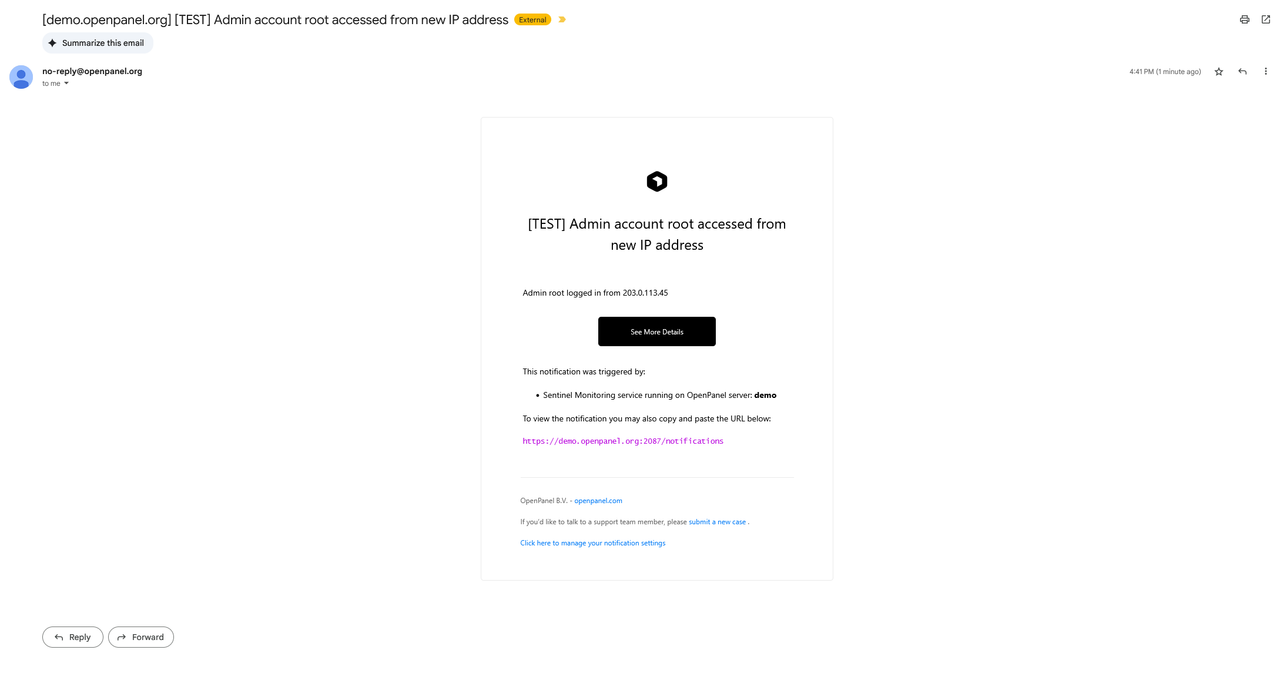
Login to OpenAdmin from an unknown ip address
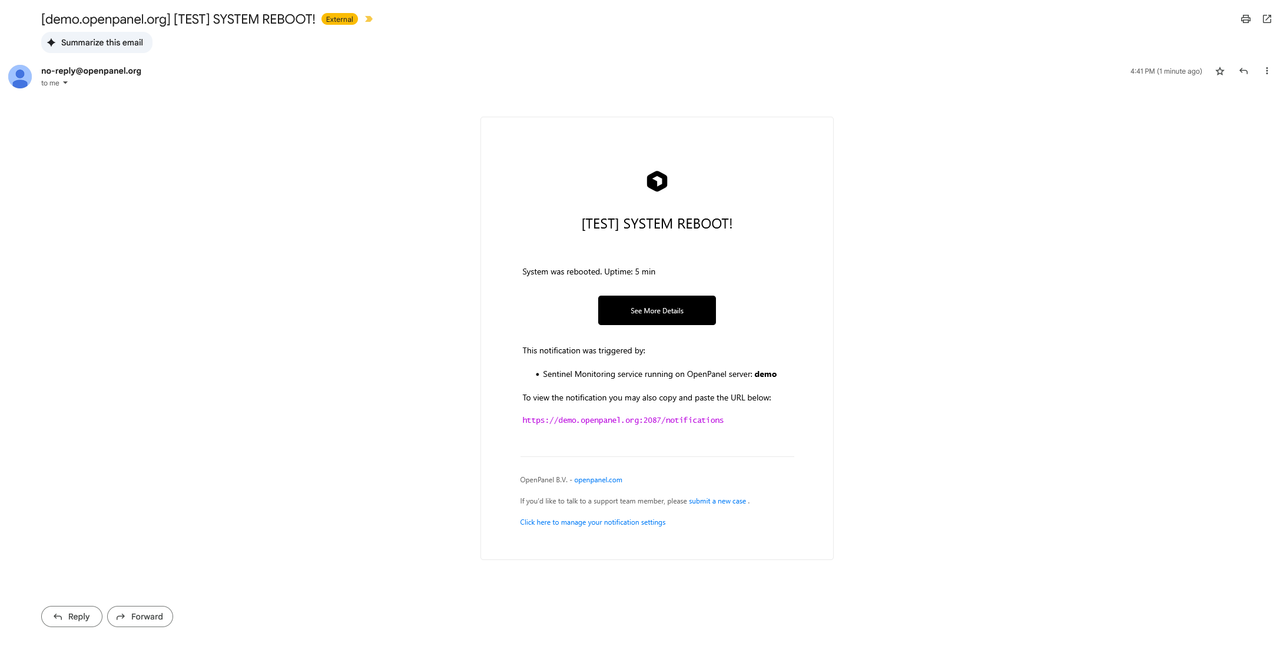
Server reboot alert
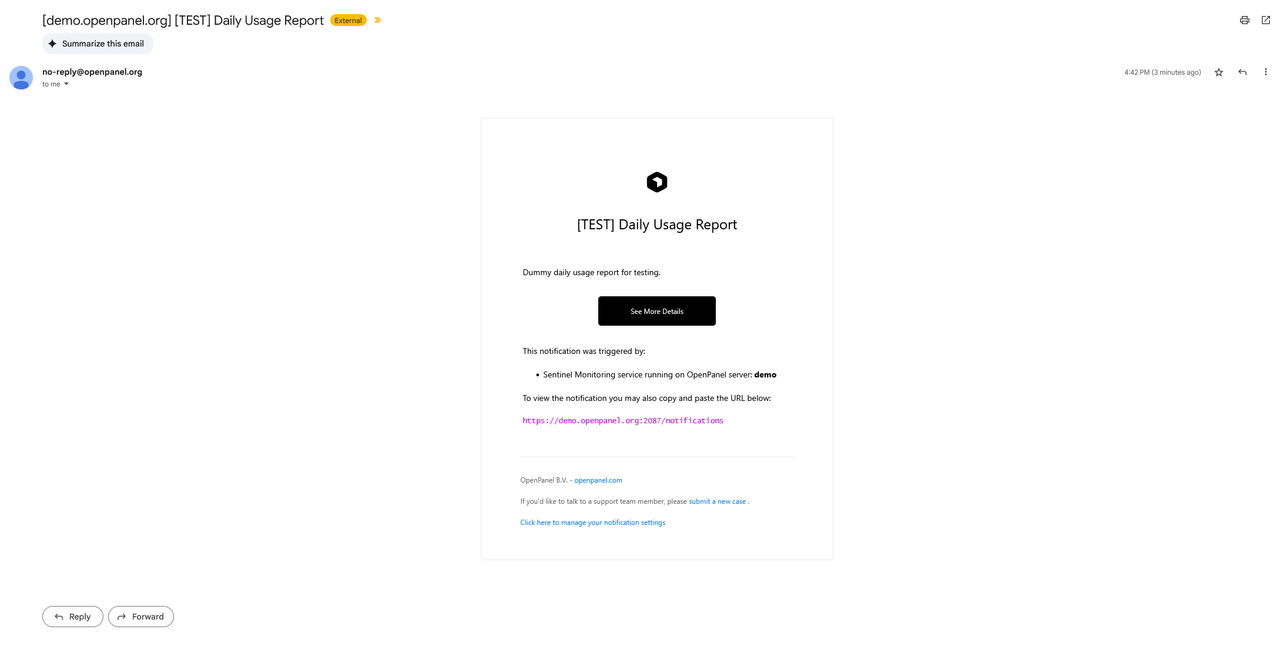
Daily usage report
Disk usage alert
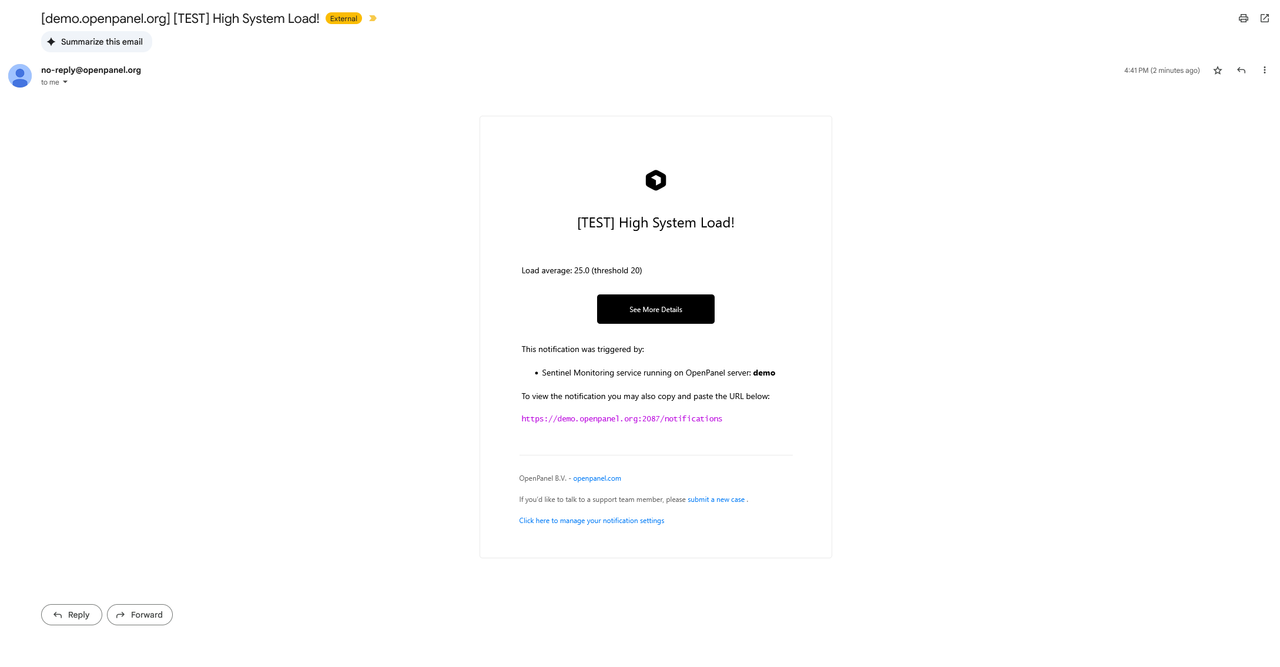
High LOAD alert
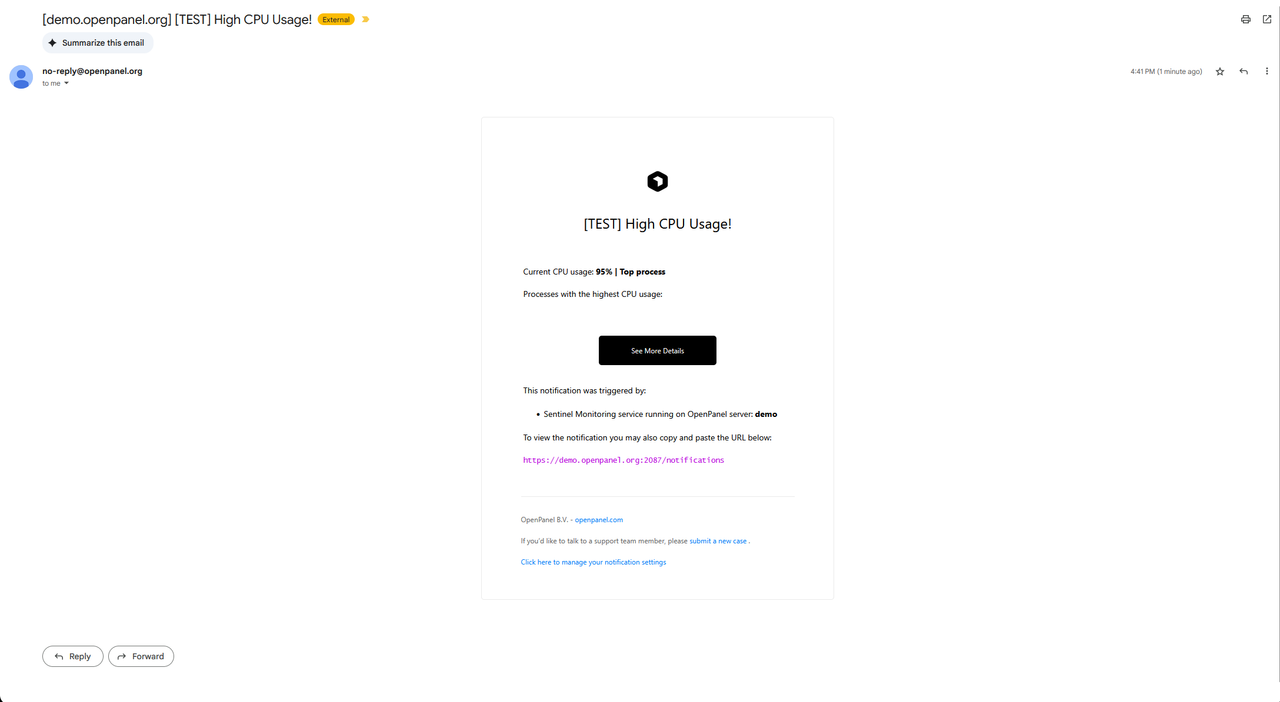
CPU usage alert
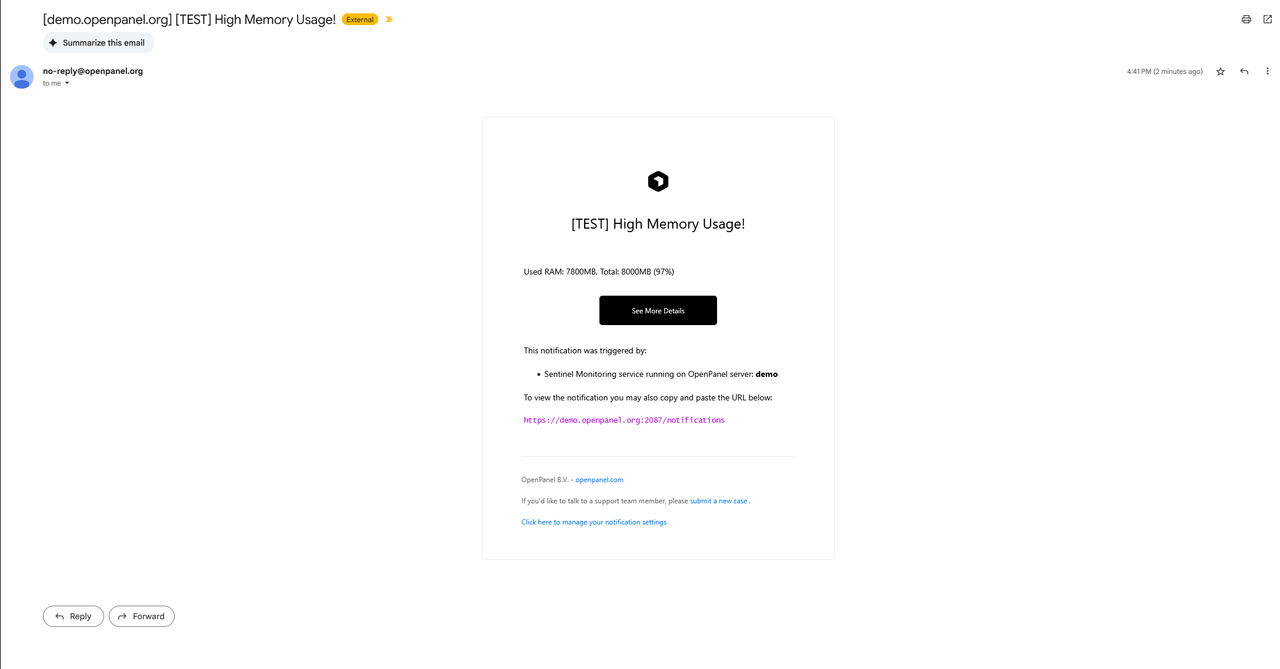
MEM usage alert
SWAP usage alert
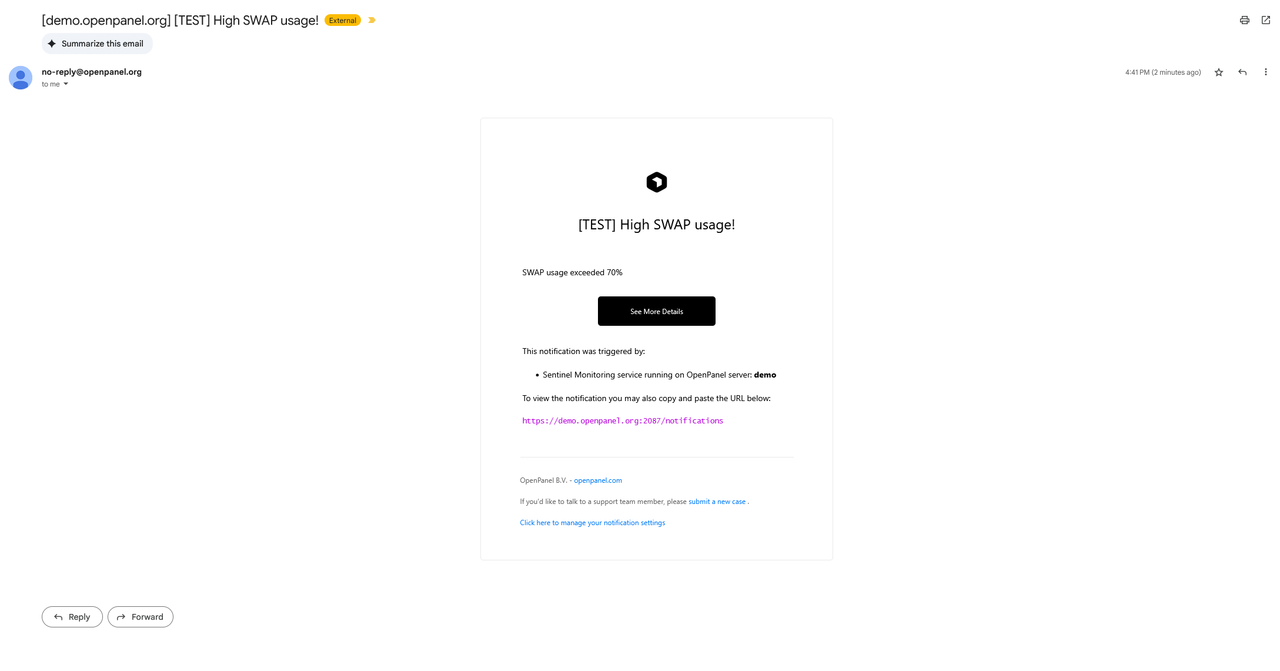
When SWAP usage is over the threshold and there is enough free RAM, Sentinel clears it with swapoff -a && swapon -a and logs a SWAP cleared info notification. It clears SWAP at most once every 24 hours. If SWAP fills up again within that time, Sentinel doesn't clear it again. Instead it sends one High SWAP usage! alert, because the server probably needs more RAM.
Example output
# opencli sentinel
...
[!] SWAP 99% > threshold 40%, already cleared 5m ago. Skipping.
...
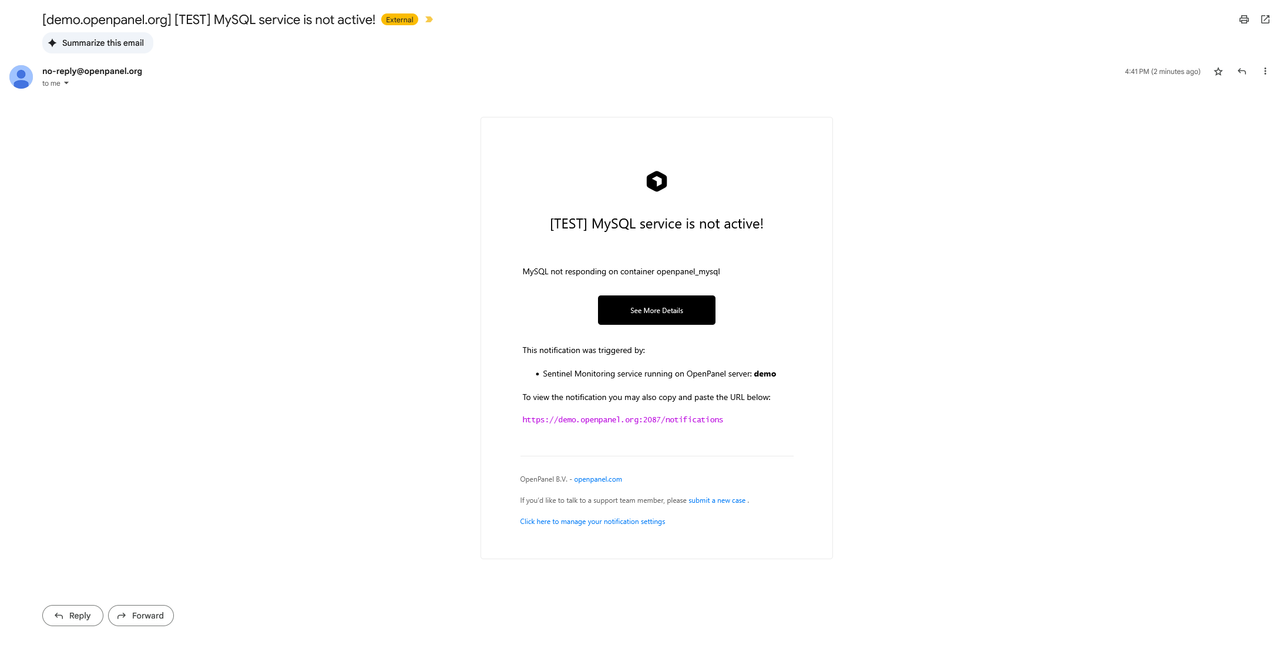
MySQL service inactive alert
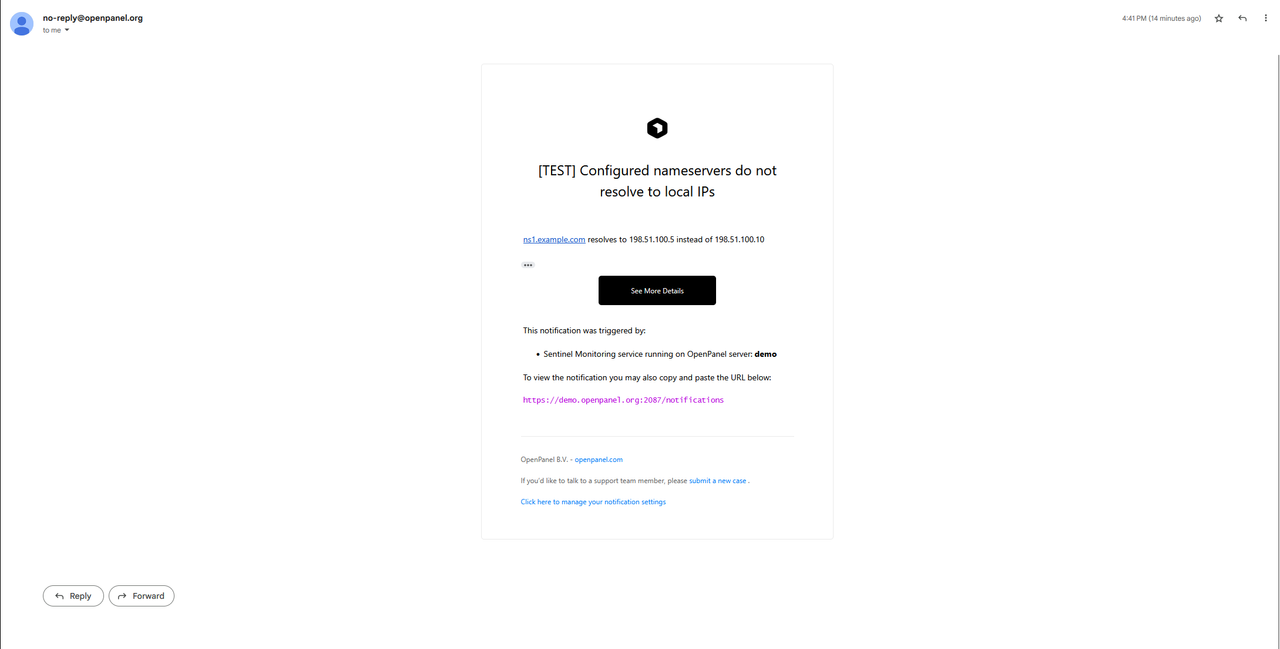
Nameservers resolution alert
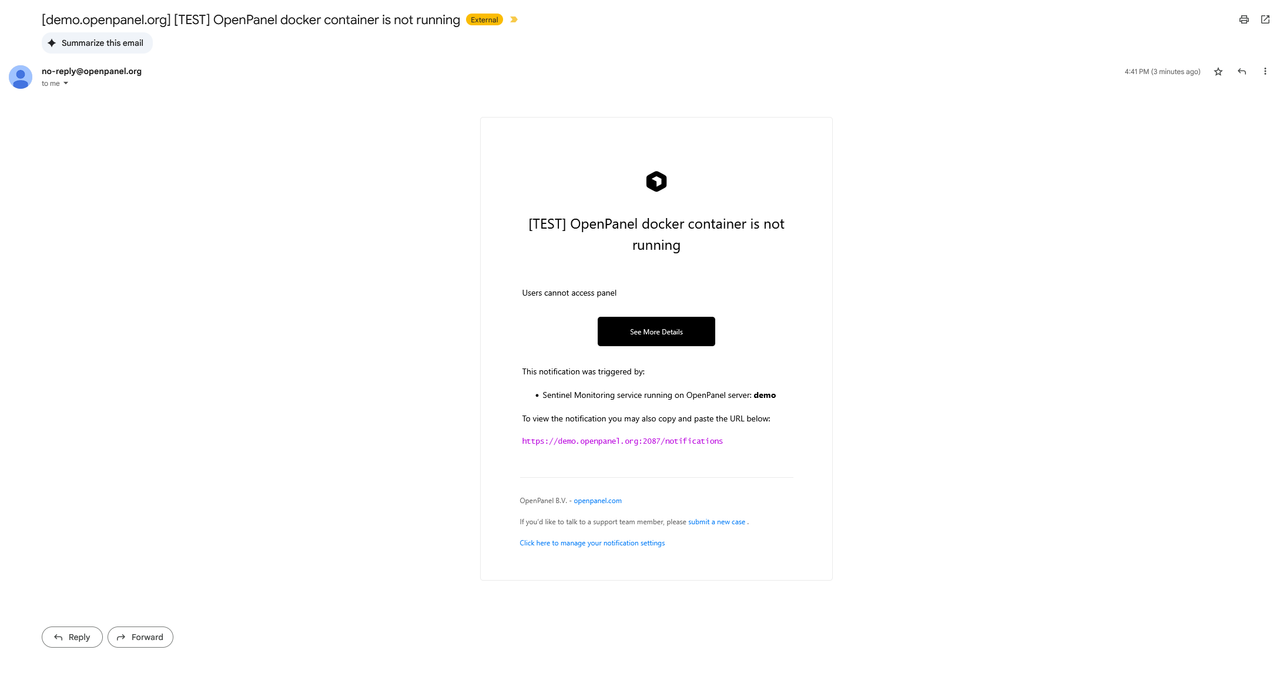
OpenPanel container inactive alert
Hostname resolution alert
- Resolved issues
- What gets emailed
- User containers
- Rate limits
- Disk cleanup
- Top users
- Blocking abusive IPs
- Mail queue
- Timeouts
- Notifications log format
- Login to OpenAdmin from an unknown ip address
- Server reboot alert
- Daily usage report
- Disk usage alert
- High LOAD alert
- CPU usage alert
- MEM usage alert
- SWAP usage alert
- MySQL service inactive alert
- Nameservers resolution alert
- OpenPanel container inactive alert
- Hostname resolution alert