Daily Summary
The Statistics > Daily Summary page shows what happened on your account and websites each day. It starts with what needs fixing, each with a button that opens the page where you fix it, and ends with the day's numbers.
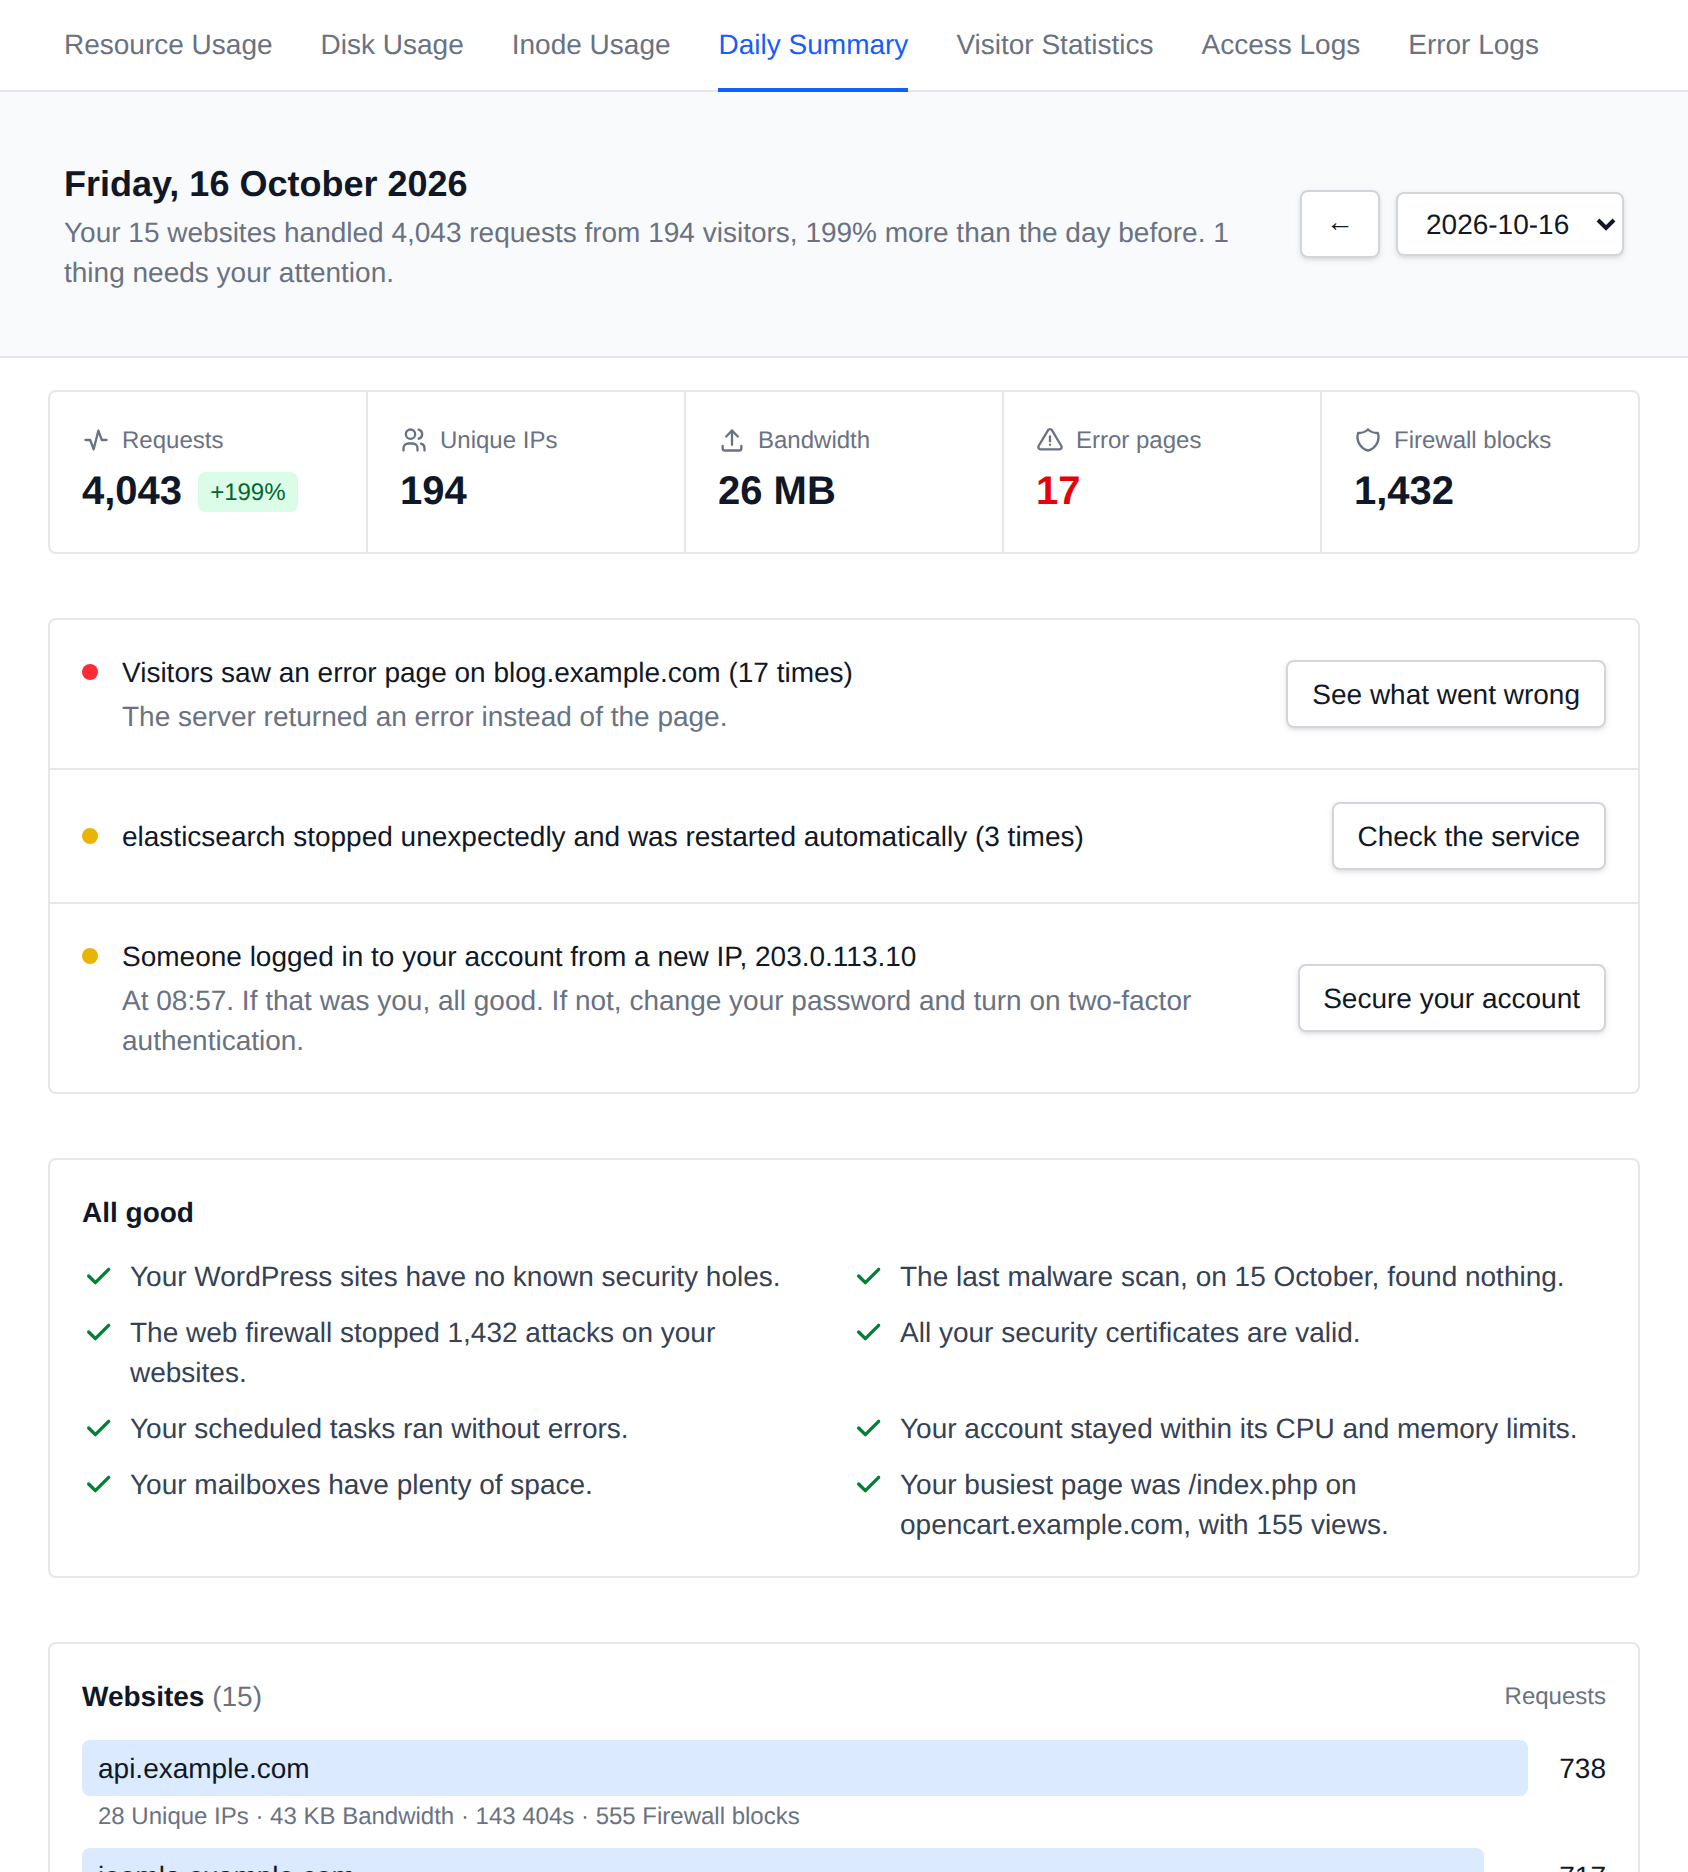
If you do not see the Daily Summary page, ask your provider to enable the Daily Summary module for your hosting plan.
It opens with one sentence about the day: how many requests your websites handled from how many visitors, compared with the day before, and whether anything needs you. Below it are the day's totals: requests, unique IPs, bandwidth, error pages and attacks blocked by the web firewall.
A summary of the previous day is saved every morning and kept for 90 days. Pick a day from the date list at the top, or use the arrows to go to the previous or next day. Until the first one is saved, the page says it will be ready the next morning.
Problems found
Each problem has a colored dot. Red means it needs your attention: visitors notice it or it puts the account at risk. Yellow means it's worth a look: it may need action. Each one says in plain words what happened and what to do, with a button to the page where you can do it. When three or more websites had error pages without a known cause, they're grouped into one item that lists each website with how many times it happened. The suggestion depends on what your hosting plan includes. For example, a full disk links to the Trash when it holds a big share of the space, to Disk Usage otherwise, and asks you to contact your provider when your plan has neither page.
| Check | Shown when |
|---|---|
| Vulnerable WordPress sites | WordPress, a plugin or a theme has a known vulnerability (needs the WordPress feature) |
| Malware | the latest malware scan found infected files that day |
| Server errors | visitors got a 5xx error, with the cause from the Error Logs when your plan has them. Many errors, or 1% or more of the website's requests, need your attention, a few are worth a look |
| SSL certificates | a certificate expires within 14 days or has expired |
| Cron jobs | a cron job failed. A job that failed every run needs your attention |
| Services | a service ran out of memory or stopped unexpectedly and was restarted |
| Disk and files | the account uses 85% or more of its disk space or file limit, 95% needs your attention |
| CPU and memory | the account used 90% or more of its CPU or memory limit in one of the hourly checks. When that happened in a quarter of the day or more, it needs your attention |
| Processes | the account had 90% or more of the processes its plan allows running at once |
| Rate limits | visitors got 429 Too Many Requests. When most blocks came from one IP, it suggests blocking it. Blocks from the server itself are never suggested for blocking |
| Backups | there are no backups, or the newest is more than 7 days old (not shown when your provider manages backups for you) |
| Mailboxes | an email account is 90% full |
| Logins | someone logged in from an IP that wasn't used in the 30 days before, with a suggestion to turn on two-factor authentication when it's off |
Checks for features your plan doesn't include are left out. All good (What went well in the email) lists the good news: checks that found nothing, attacks the web firewall stopped, the last backup, and your busiest page of the day.
Websites
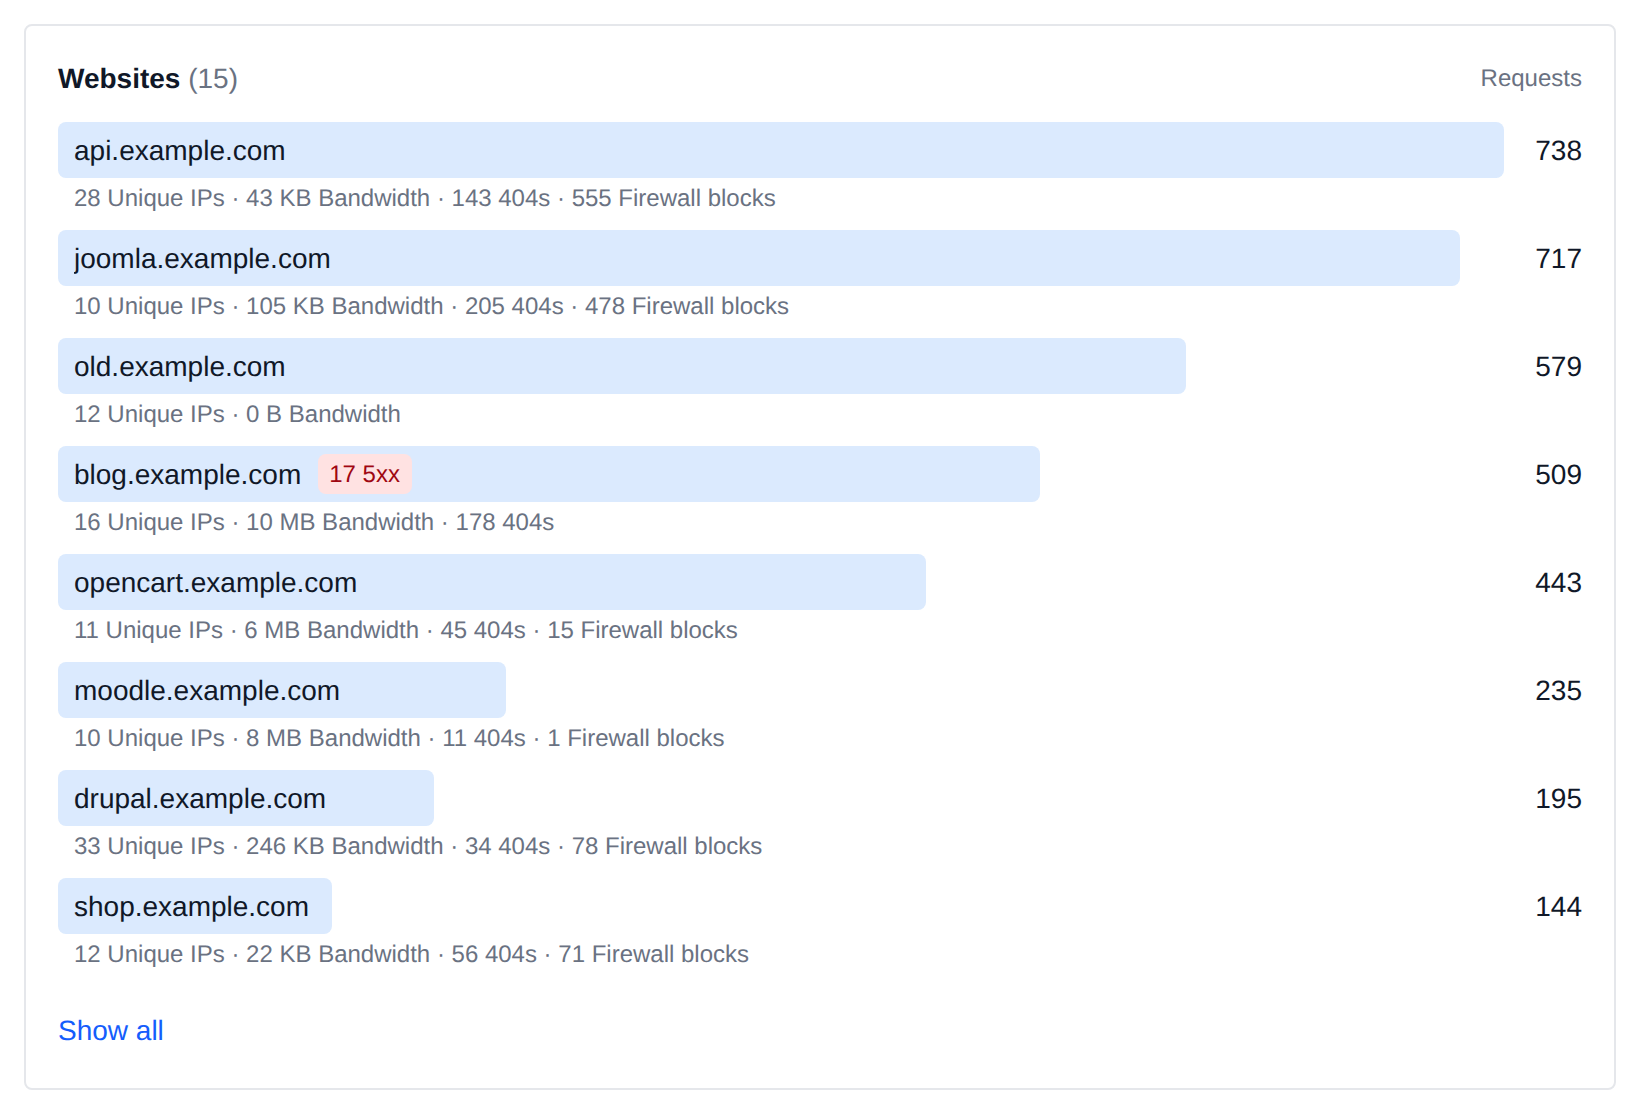
Every website with traffic that day, busiest first, with a bar for its share of the requests. Under each one are its unique IP addresses, bandwidth, 404 Not Found responses, requests blocked by the rate limit and attacks blocked by the web firewall, and a red badge when visitors got 5xx errors. Websites in subfolders, like example.com/blog, are listed on their own. The first 8 are shown, click Show all for the rest.
Unique IPs count every visitor's address, bots included, so they are higher than the visitors analytics tools report. Bandwidth is what your websites sent to visitors.
Resource usage, logins and changes
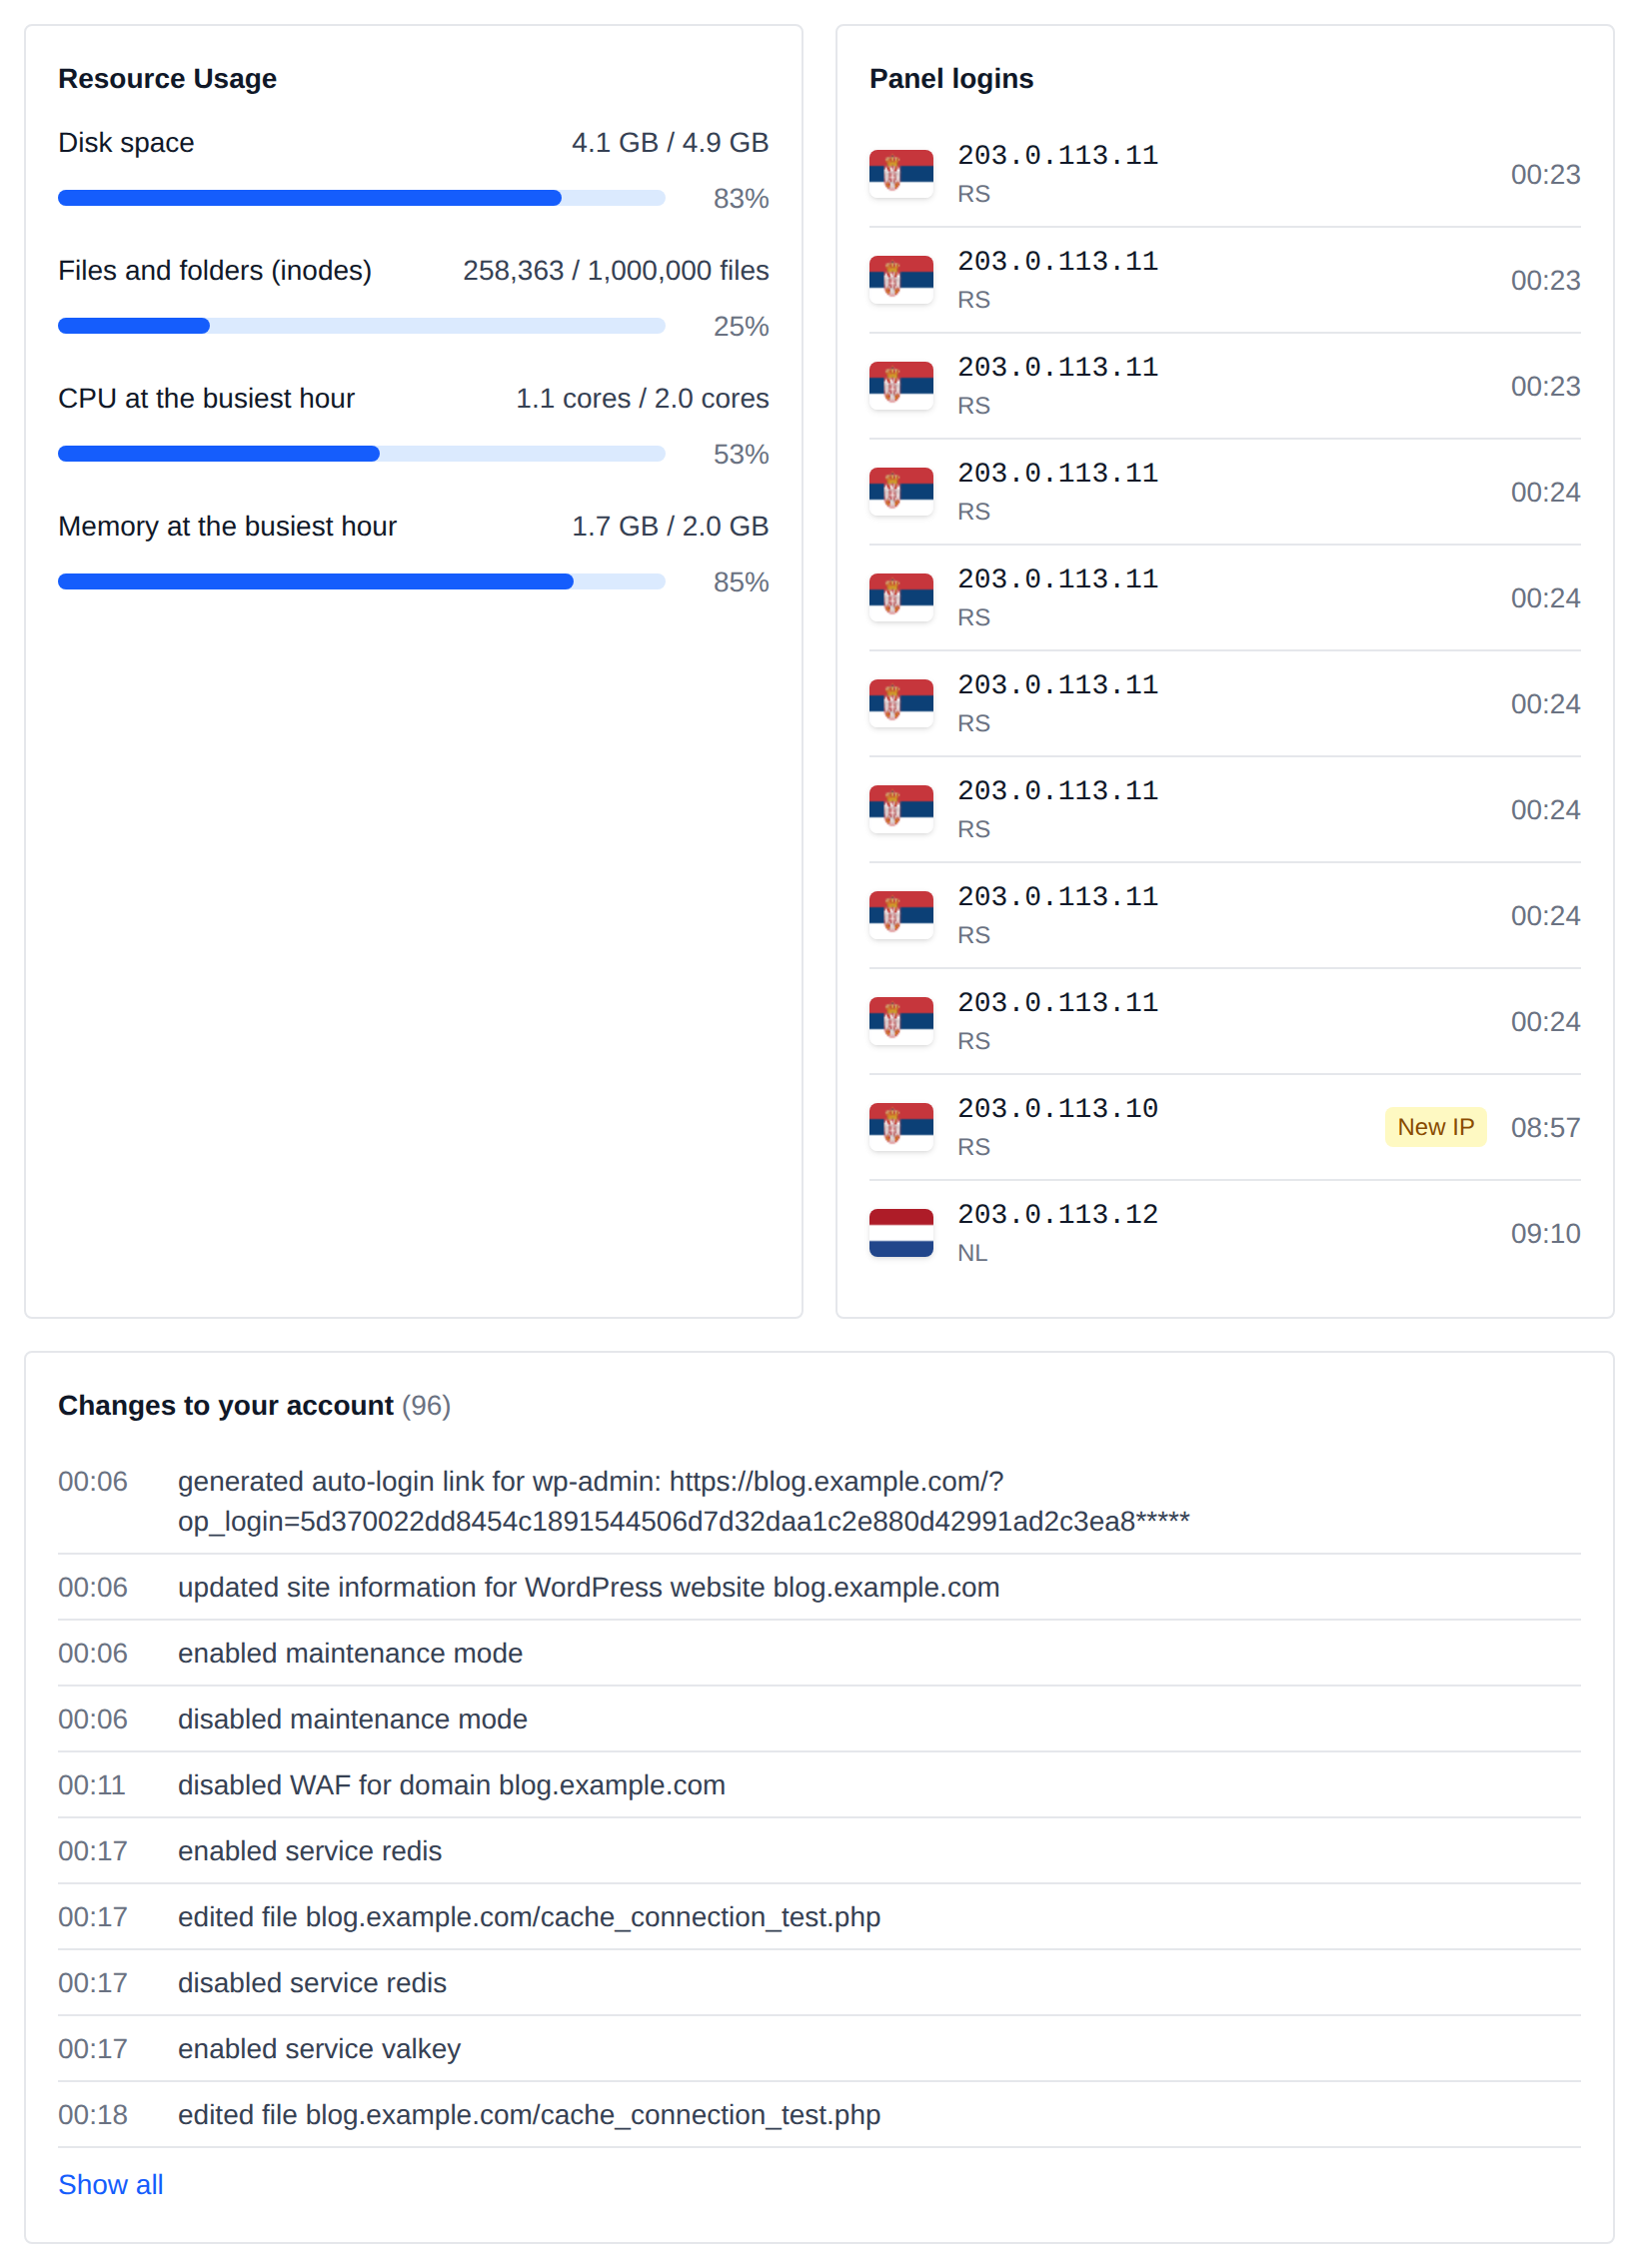
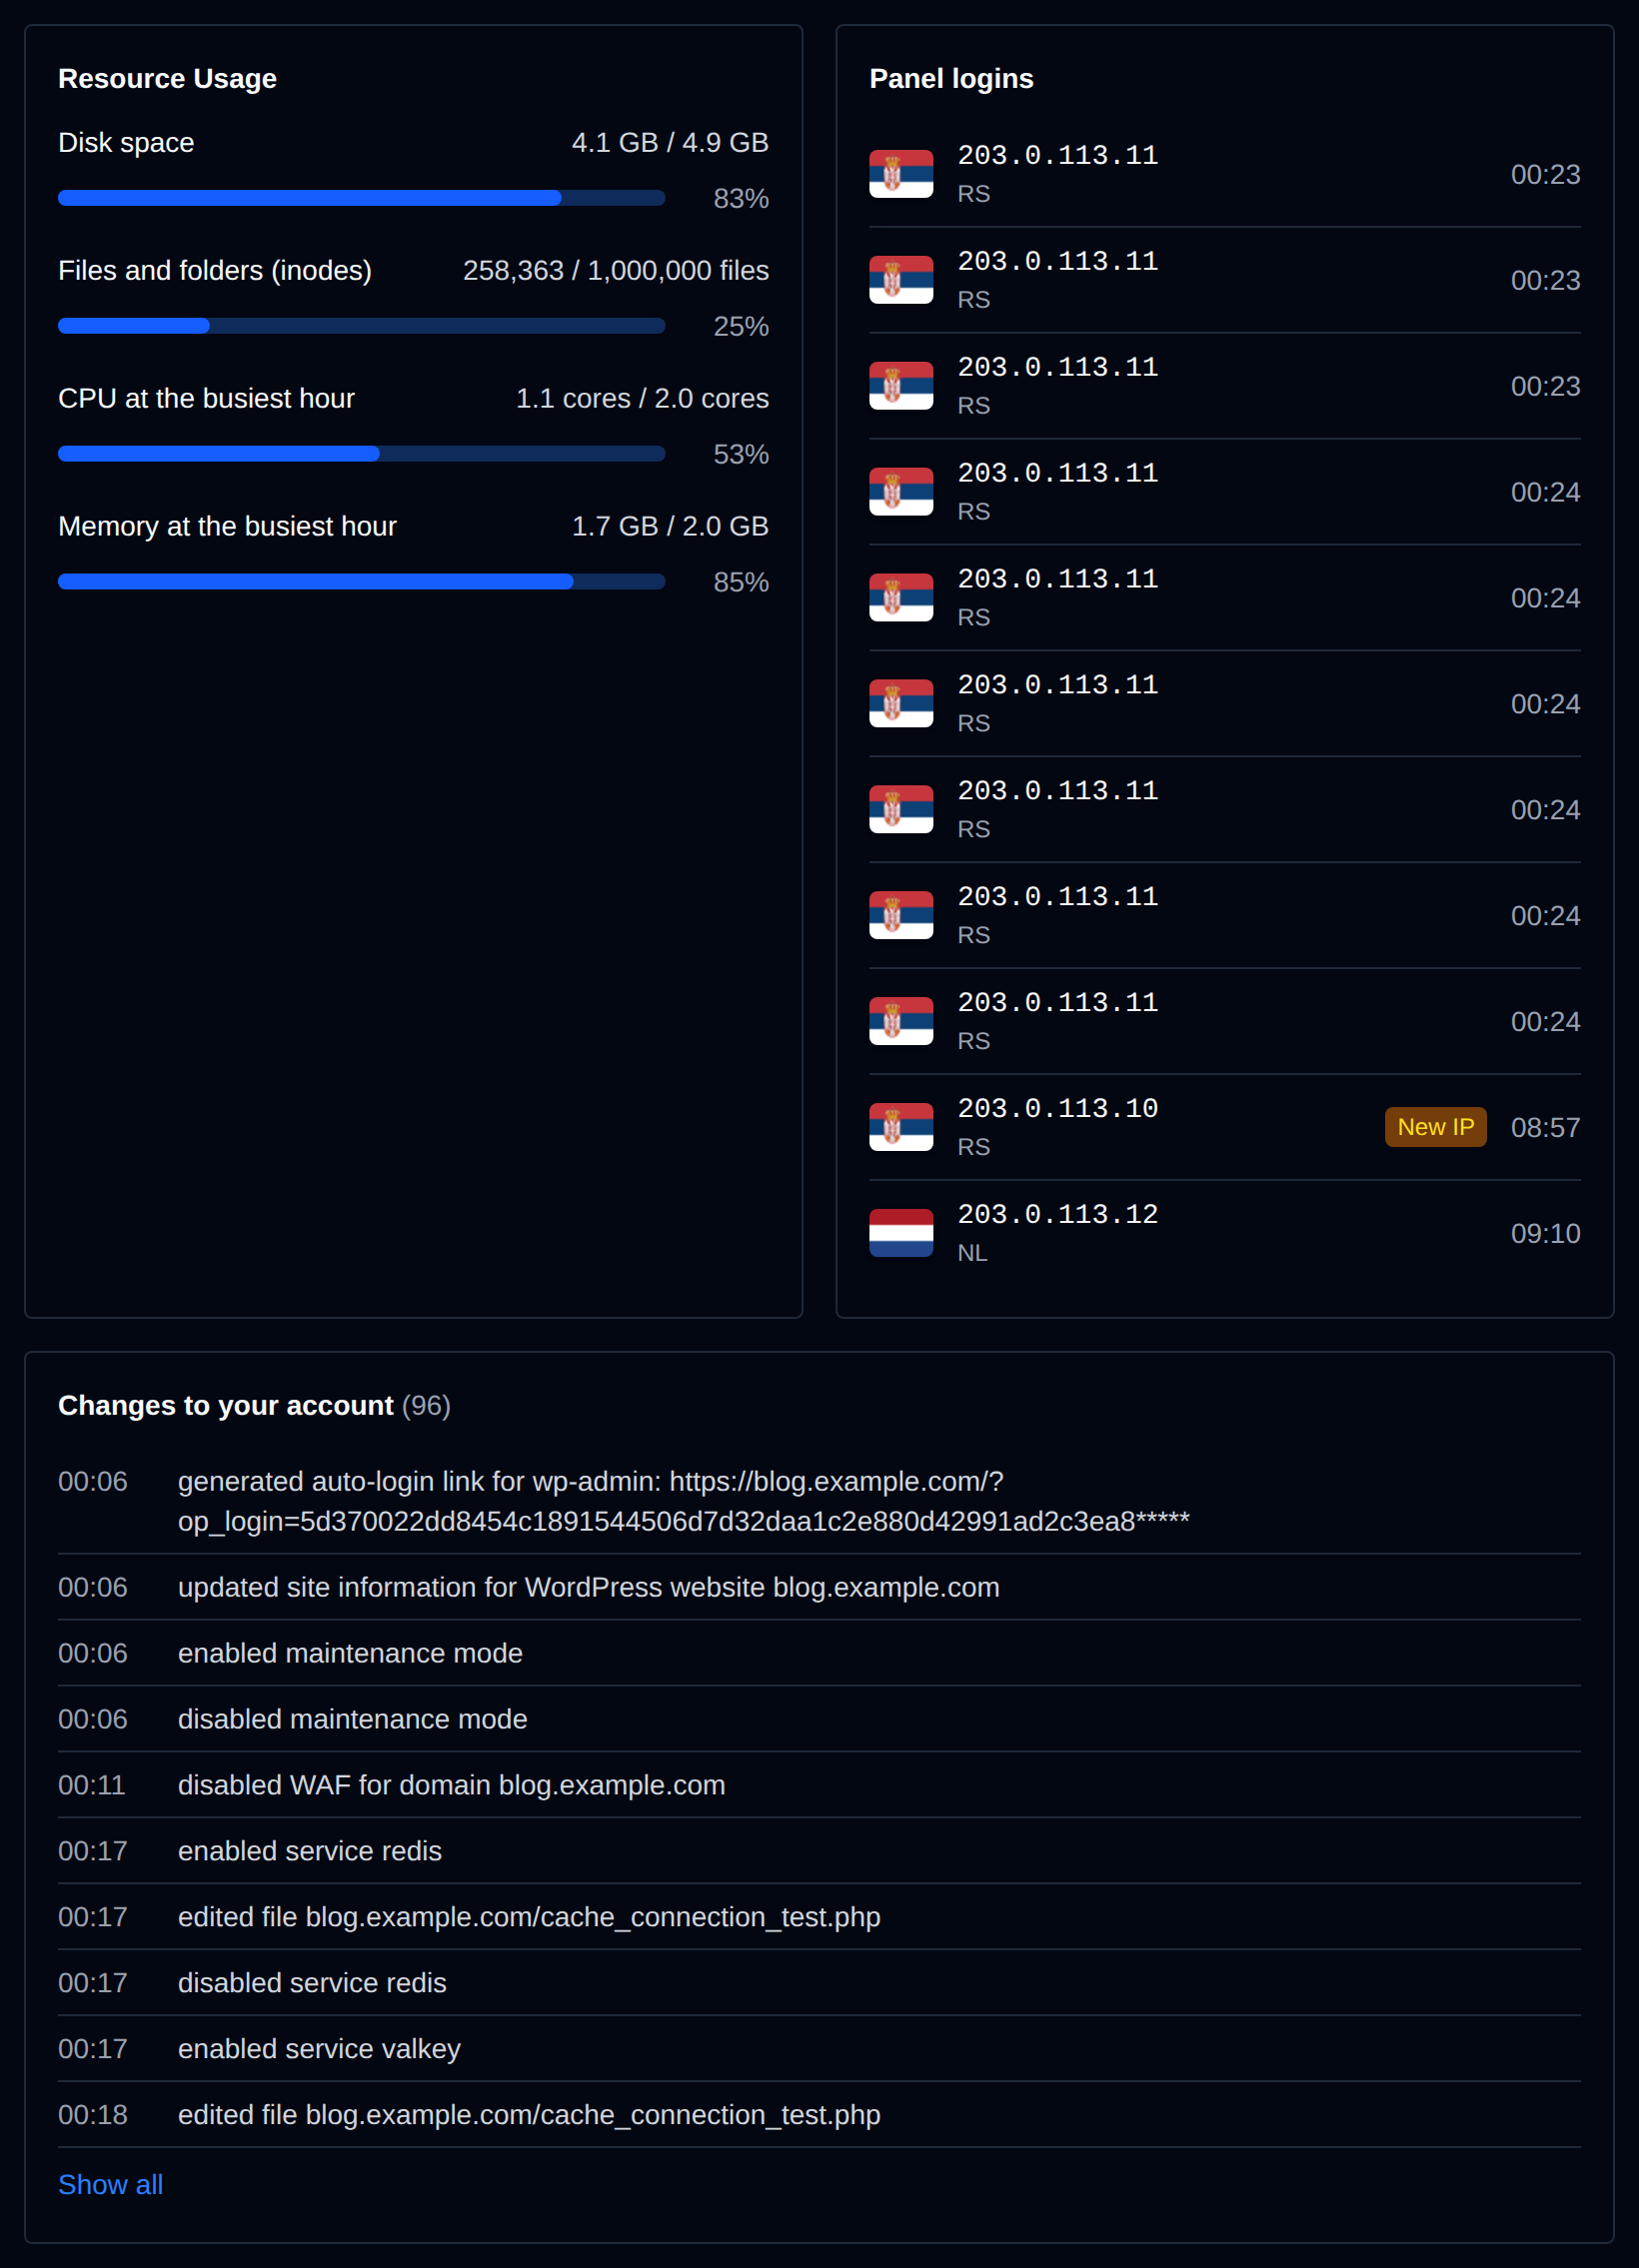
- Resource Usage: disk space and files against your plan's limits, and the CPU and memory used in the busiest hour of the day, from the hourly checks also shown on the Resource Usage page.
- Panel logins: each login to OpenPanel with its IP address and country. IPs not used in the 30 days before are marked New IP.
- Changes to your account: the changes made that day, the same ones shown in the Activity log. Long lists show the first 10, click Show all for the rest.
On the dashboard
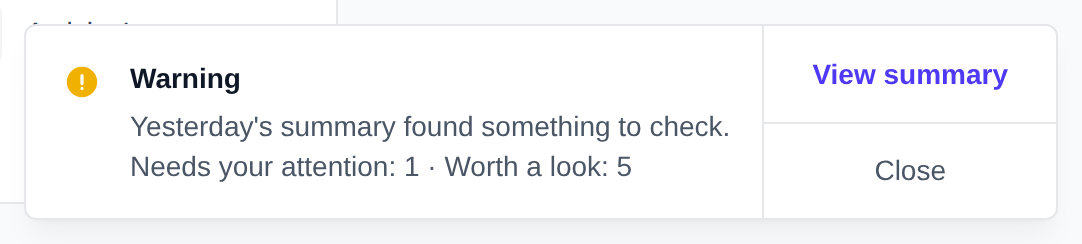
When yesterday's summary found something, the Dashboard shows a notice with the number of problems and a View summary button that opens that day. It shows once for each summary, and not while the setup wizard is open.

Getting it by email
To get the summary every morning, turn on Daily summary on the Notifications page. The email has the same sections, with disk, CPU and memory drawn as bars, links straight to each fix, and ends with a link to that day on this page. The summaries are saved on this page whether the email is on or off.